Data Description:
The dataset I selected was the census of NY religion by County. It consisted a lot of fundamental information as well as more detailed pieces of information. Looking at the row of data collects; it shows that the years 1850-1890, state (New York), counties, denomination and the number of churches that had been collected over the course of four decades. The geographic data refers to the data that looks at the number of church within a demonization and which county these churches are located in. The geographic data is the set of counties, which this dataset focus on state of New York. The numeric data is the year the data was collected, in addition to the number of churches. All three descriptions are vital in breaking down the number and words that were given in the census.
As I explore the various columns and rows of the dataset its hard not to notice the different ranges of trends, with these trends forming it natural develops a story. The first column is a section of number (years). Its numeric column ranges from the year 1850 and goes to 1890. It resets the year every time it switches to a new demonization it is calculating. This column provides us with the information needed to know which years the data was collected. The next column is the state in which this data was collected. It is consistently focused on the state of New York. The next column is the county in New York. The counties are arranged in alphabetical order and restart as well, every year that the data was collected. This keeps the data extra organized. This column is geographical, because it depicts where all the churches from each religion was local a crossed the state of New York. The counties were being counted starts with Albany and ends with the county of Yates. When this data was being collected there was sixty-two counties that contributed to this census. The next column looks at the demonization that was being established in New York during the census. This is a textual column because it is starting with the Baptist and Congregation denomination; it also looks various denominations such as Judaism, African Methodist Episcopal Church (AEM) etc. The final column the census looks at is the number of churches in a particular denominations within the previous counties discussed. This is a numerical column; the number of churches ranges from zero churches established in a county up to eighty counted in one denomination and in one particular county. With this sample of the New York Religion by county we can gather a great deal of information. It allows the viewer to piece together a story just by examining the finer details within the rows and column of the census.
Data Visualizations: (Map of New York)
With the dataset collects a story develops out of the number and text that is provided. The story of how throughout the four decade that data was collected the United States, more specifically New York became more and more of a melting pot of religions. People believed that migrating here whole heartily hope that this was a land of opportunity. When this data was being gathered. The nation was transitioning into a working class society. Where wage labor and having a boss was becoming the norm. Rather than years prior when individual shaped this country and farming was a major dynamic of this nation. Immigration will play a big role in the years to come. In these next decades urbanization will also be playing a role.
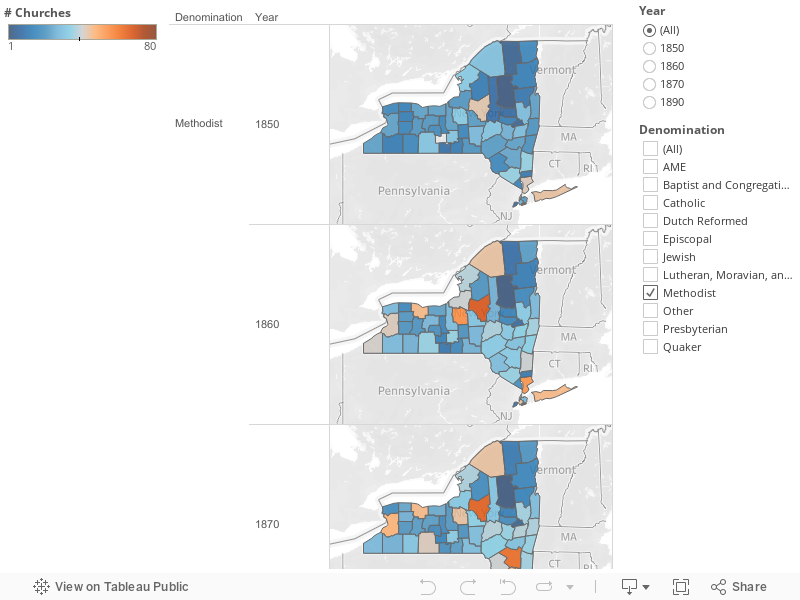
The dataset it includes information about religions that we being established in the state of New York. Every ten years apart from the year of 1880, it was kept track the amount of churches and what denomination it belonged too. This contains valuable insight into the rapid spread of religion in the New York. It provides insights as to how many churches in each demonization were being used and in which county were these churches being worshiped. This visualization allows the viewers to compare the different types of denomination, which ones were popular, when and where they were located in New York. With the visualization of the map you can see which religions were promenade throughout the curse of the dataset. It maps out all of the different counties giving the viewers a better visual to see why certain place may have higher church counts and why other may have lows counts. The visualization enables us to show the progression or digression of every denomination that was collected in the census. The map of New York shows the progression of most of the demonization and the down fail of others. It shows religions that were previous not existent such as AME. Its shows the immigration patterned of each religion. Most of them start in the cities because that is where the immigrant ships first dropped them off. As times goes on and the cities get filled with corruption and filth. People started to move to the outer counties, taking with them their religious beliefs. Immigrant could have started creating their homes in the Queens, Kings, Suffolk and Richmond County. Later in the 1890 the viewer can see the progression of churches being established in counties such as Erie and Genesee. By looking at the map you can also see the out of ordinary the number of churches will jump. For example in the county of Oneida, the denomination of Presbyterian was consistently around twenty churches up until the 1870s but my 1890 the number of churches shoot up to fifty-four in that county. Same goes for the Erie county the number of churches on the Lutherans, Moravian and German Reform church prior to the 1870 was about twenty and it too by the end of the last data collected in 1890 the amount of churches double with fifty-four in Erie county as well.
Process Documentation:
I started my quest to better understand the census by using Tableau. Incorporating different combination of rows and columns to see what kind of results I would get make things interesting but also complicating because the design on the computer looked like it would make a complying point but in reality I would make the viewer extremely confused or not understand the story I was trying to make them understand. Before creating my graphs the census was just number and words to me, they had no significant. But once I started to play around with Tableau and familiarize myself with it. I could see how vital it could be.
Once I started putting the pieces together I started to notice trends. I made my data into a geographical graph, I made this decision because I believed that it would show the ample difference between the denomination and which counties they were located in. This aloud me to sort out the number of denomination in each county by color to make show the differences of each county but year I used complementary colors like orange and blue. A dark orange symbolizing the largest amount of churches in one denomination and a dark navy blue to repent the lowest or zero churches in said county. Once I had my graph made trends started to appear on the computer screen. I was looking to keep the graph easy to navigate through. It became too much information over load even for myself, to look at all at once so I decided to use filters in my graph. With a click of the mouse the viewer could now just look at one denomination and its raise or fall over the four decades that the data was collected in each county of New York.
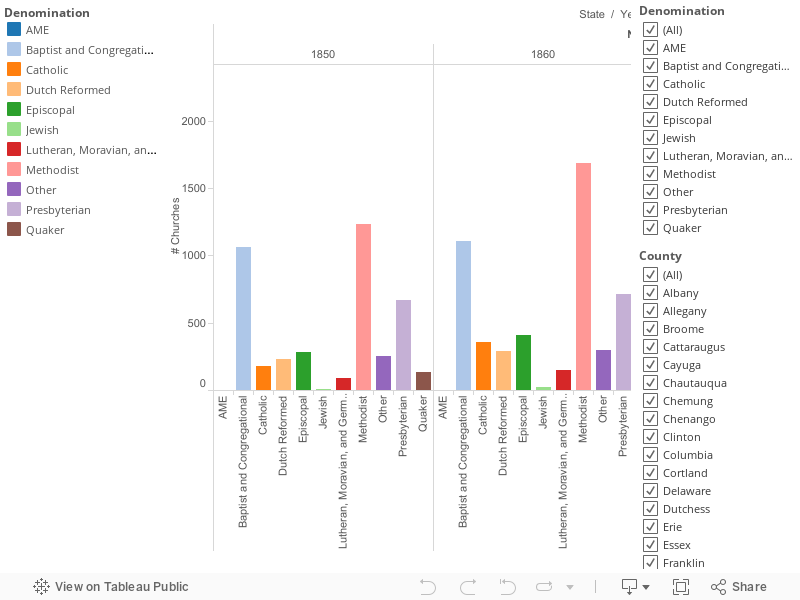
For my second graph I decide to go the route of making a bar graph it was actually the first graph I made using Tableau. By using the bar graph it enabled the viewer to see the total amount of churches in each denomination for the state of New York. I believe with the bar graph you could make out a better story than with the geography map. With the bar chart each denomination was give a different pastel colors. A part from the hideous brown color bestowed to Quakers. Within the large bar chart each year that the data was collected was given their own dataset. With the bar chart it help show the progression over time of when religions some doubling in the number so churches. It also brought to my attention some outliers or missed data. For example it data claims that in 1870 there were not Jewish, Quaker or Other denomination accounted for in that year. Then when by 1890 results appear for all of those denominations. I decide that this bar chart should also have a quick filter just so the viewer want to look at one denomination is one county they could have that option. Even though if you hoover the mouse over one of the bars it tells you in alphabetical order which county it is and how many churches were there.
Argumentation (Map of New York):
When looking at the visualization there are something’s that drew my attention. The color contrast of the orange and navy blue caught my eye while I was clicking around with my quick filters. While clicking from one denomination to the next, started to see a elucidation as to why the dataset may look this way. The first thing that grabbed my attention was the increase number of churches.
When doing research for my data I was intrigued to find many different connections for all aspects of the data. The New York State religion census is categorized in a variety of number classification such as the location, the county of the church within New York State and what denominations the church is affiliated with. The information that is given to the viewers allows them to piece together the lives of the citizens who lived during this time and to get a better sense of what religion theses citizens practiced. In the data shown, 1850-1890, the viewer can see the steady growth of most all of the various religious denominations that were established in New York State. Additionally, using my first bar chart, featuring the different dimensions over time, it can be concluded that the most dominant religion sect establishing itself throughout New York State were the Methodist, Baptist and Congregational. Presbyterians however, shown by the data, did not see dramatic increases its church presence throughout New York State. Through the time period of 1850-70, the number of churches remained constant at about seven hundred every time the data was collected. The data also concluded that the Quaker churches in New York were the only denomination experiencing a decrease in numbers. By 1870 the data that was collect suggests that no Quaker churches were present in any New York county. Finally by 1890 they reappear, with only ninety-two churches. I believe the influx of churches correlates what was going on in American history, the first and second wave of immigrants and the urbanization of America. The first waves of immigration to the United States happen in 1840-1860. At this time immigrants that were coming to the land of opportunity were mostly Irish and German. As the second wave approached in 1880-1940, is where the data set stopped in 1890. The immigrants that were arriving to the United States were mostly Eastern and Southern Europeans. During the first wave, on average, about 2.4 million came to the land of opportunity. For the second wave on average about 5.2 million came to America, more than double the previous wave, this shows the sudden increase in Judaism at the end of the 1890. Judaism is a prominent religion in the Eastern and Southern parts of Europe. With America’s rise of immigration grew a concept know as Urbanization, a process by which towns and cities are formed and become larger due to increase people living and working in those areas. Once the immigrants got off the boat many of them had very little money to travel out of the city where their ship had ported. These people stayed and correlation with the immigration increase, lead to Industrial growth in those pockets of newly arrived immigrants seeking work. In my map data set of New York, the number of churches and the variety of religions found in the county of Queens, Kings, New York, Richmond and even Suffolk doubled in size. During these times America develops into working class, where wage labor replace an agrarian work concept that was prior, a nation of farms. Going from someone that controls your own wages and the amount of food you can provide for family to one that was dictated for you is a huge shift from farming and being independent, to someone (Boss) controlling your wages.
Further Research Question:
When I was examining my dataset and as I was creating my visualizations, different question popped up that with further research might lead to something. While look at my geographical map I notice that the county of Schuyler was not counted for in the first year of the dataset, 1850? Was it not considered to be a county, and during the ten years of waiting to make the next set of data did it become a county. Looking at the same visual during the years of 1850 and 1860 Suffolk county Methodist church was counting to raise but then by the next year they collected the data 1870, the number of churches in that drop dramatically to nine churches. What cause the sudden down fall? Was it an error on the collector of data? I claimed in my argumentation that immigrant had to deal with the influx of churches and the more increase variety of denomination with further research that question could be answered. A trend you see with the visualization is the Quaker religion is one of the few denominations that decrease throughout the dataset. What caused the pushing away people from the Quaker denomination?
With my bar chart visualization it aloud me to see different flaws or kumquats that dataset had collect. Only with further research could these questions be answered. The First to note is by 1870; the denominations of African Methodist Episcopal Church (AEM), Jewish, Quaker and other were not calculated in that year’s census. I have mention before that the year 1880 census was not collected. There is not data found on that particular year. What happened in 1880 that people made the decision to not collect the sense? Look at the visualization something that surprised we was that the Dutch Reform denomination have one of the lowest number of churches established in New York. Now living in Albany I know that the Dutch were one of the first people to settle in the state of New York and more predominantly Albany County. Whoever this dataset shows that was only had the second highest amount of churches established in There County. What took the led was Ulster County. In addition by the 1890 is fell to third falling behind Kings County. Why is that a county know for being settled by the Dutch had so few churches established? The Methodist religion was the predominate religion is the state of New York, I would be interested to see why and how did it become so popular is the span of four decades.