Over the years much information has been collected on the citizens of the United States. Many people are not aware but each time a questionnaire of sort is given out, the information is collected and possibly put into a census. A census is an official survey of a population; it records various details about individuals. Many different categories are put into a census. Some of those categories include name, race, age, birthplace, eye color, hair color, occupation and much more. A census provides government officials with information that becomes useful when deciding on things such as the distribution of public funds and on a broader scale, a census helps show how the country is changing. The use of censuses has been around for quite a while and has provided useful information from the past that proves relevant to historians and those alike today.
Data Description
When a census is looked at, it is often of a particular city to find specific answers to questions about the people and what their lives may have been like. The 1940 census data set provides viewers with information about people that lived in Albany at this time. The census includes a lot of demographics in comparison to some other data sets; when looking at the data, the person’s name, age, race, address, marital status, education level and things of the sort can be found. The data set includes numeric, text and geographic information. The numeric includes age, estimated birth year, income, and the value of the person’s home. The text includes whether the person rented or owned their home, their relationship to other people in their home, gender, race, marital status, whether they attended high school or college, highest grade they completed, their employment status, birth place of their parents and their native language. In comparison to the numeric and text information given, the geographic information is not much; it includes the individual’s birthplace, residence and street name. In each column that has numeric data, the data varies. For example, the column that pertains to the age of those listed in the data set ranges from the age of 1 to 87, the value of the homes range from 20 to 10,000, the income of each person varies between not having an income and making as much as 7,500 dollars. The geographic range of the data shows that many people lived around the same areas; although some of these people are members in a family, there is a significant amount that seems to have no relation to one another but live nearby.
Most of the people lived in the downtown area of Albany; the locations ranged from Hamilton Avenue, Stanwix Street, Delaware Avenue, Barrow Street, Second Avenue and other neighboring places. The rows in the data set present us with a variety of information; the subheadings for the rows include race, address, age, employment status and other information. All of these subheadings either describe a person (the individual’s age, race, marital status etc.), a place (address) or a thing. The columns in the data “answer” the questions that the rows ask. In other words, the columns provide the information that is missing. For example, if the rows are named age, race, occupation, address, employment status and other demographical information, the columns fill in the gaps and provide that information. Most census work the same way with the type of information that is provided and how the information is given; the rows and columns are set up in a way that makes it easy for the viewer, whether it is a historian or just someone that likes looking at census data to parse out the information and find what it they are looking for.
Story
Education and the type of occupation one holds are often correlated with one another. From the time a child is put in school until the time they finish, it is drilled in the head of the individual that a good education is needed in order to obtain a well-paying job. It is taught that hard work breeds success and young men especially are taught to be providers for their families, which comes into play with the types of jobs they seek and level of education they want to achieve. Although, in most cases, hard work does breed success, this what not necessarily the case for some people that are a part of the 1940 census. The census provides a wide range of information including the types of jobs that were held, the race of those that held these jobs, their level of education and the difference between men and women when it comes to the work force. It is evident that many women did not work and often stayed at home to care for their children and other household duties. Although many of the women did not work, some did and they held quite prestigious jobs. In addition to more men being in the work force than women, the men began to work at an earlier age than the women. There are numerous jobs held by the men and women in the 1940 census; some of the jobs include accountants, barbers, bartenders, book keepers, lawyers, carpenters, cooks and much more. The different jobs show the level of education that those in field held and how many people the criteria applied to. For example, one of the jobs held is a file clerk. Some of the people that were file clerks had different backgrounds in education. The census shows that twenty-four people completed high school and eleven completed elementary school-this shows that being a file clerk is not a job that may qualify as being of high standing or one that a person needed to have much experience in. In comparison to those that are lawyers, three people completed college and nine people went beyond a college degree. This shows that being a lawyer was a great accomplishment, one that not many could achieve for one reason or another.
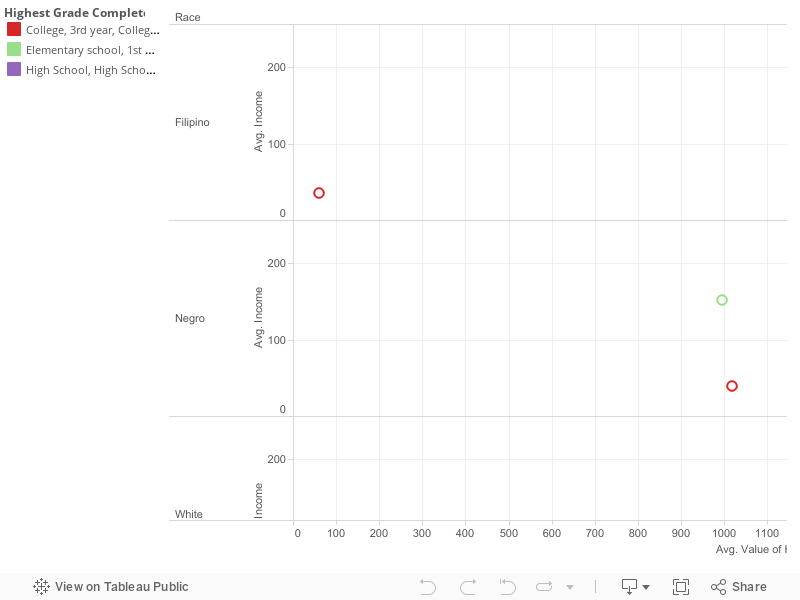
Although it is known that there were different ethnic groups living in Albany at the time, an initial look at the census makes it difficult to figure what ethnic group or race on a broader scale held what job. A visual needed to be created to parse out the information that could not automatically be seen when looking at the census. The visual used is a scatter plot; the scatter plot breaks down the different races that the census displayed, which for this census is African American, Caucasian and Filipino. Although the scatter plot does not show what types of jobs people from these races held, it does show that there was still the unfortunate circumstance of white supremacy in the 1940s. The plot shows that the African Americans and Filipinos were able to acquire a college education whereas the Caucasians of this census did not but yet, they still managed to remain superior. Their homes were worth more and they made more money in the workforce. As previously stated, this shows the pattern of white privilege and white supremacy that has been evident in history since the conquering of nations and lands began. Education, although important, is not the only factor that goes into someone having a decent job, decent place to leave or making a decent salary as the scatter plot shows. Education levels differ gravely between these races but they also differ between ethnic groups which can be seen with the second visual.
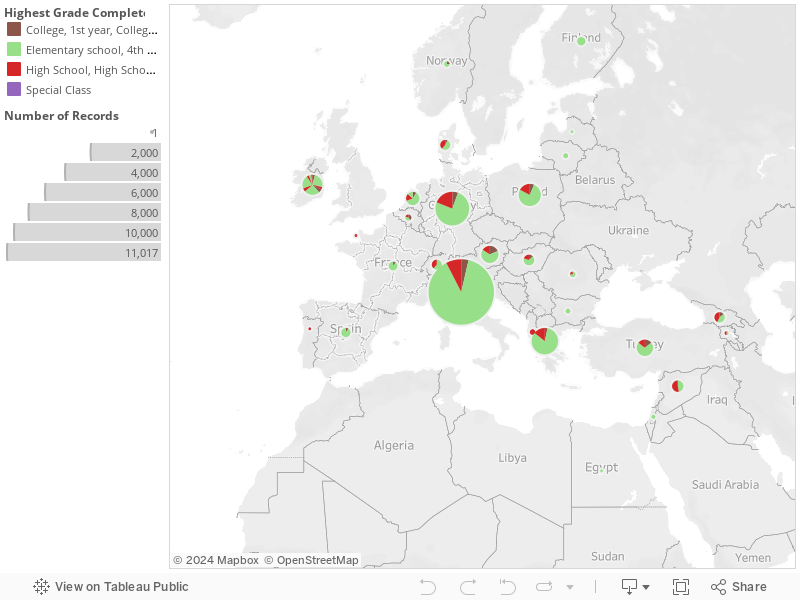
The second visualization created is a symbol map. The map shows different countries around; the countries are a representation of the birthplace of the people in the 1940 census. Most of the countries have a pie chart affixed to them. The pie chart breaks down the different education levels seen in each country and the number of people that records show have that level of education. When the charts are looked at, Italy and Germany have the biggest pie charts, which indicates that they may have had a larger population living in Albany in 1940. In recent demographics, the same seems to still hold true. “In 2004, estimates of foreign born population was looked at. The top ancestry groups in New York State are Italian American making up 15.8%, African American at 14.4%, Hispanic making up 14.2%, Irish at 12.9% , German at 11.1% , English with 6%, and Polish at 5.27%. According to the data, 1.5% of the state population is multiracial.” The Italian and German population still holds strong years later. The map shows the highest education levels achieved by Italians and Germans, which is an elementary school level education. There are high school and college level education reached by people from these countries as well as other places such as Turkey, Austria and Poland. Although Turkey, Austria and Poland have education levels reported, their charts are not as big which can be due to a smaller number of people from those places living in Albany.
The differences in education levels pertaining to the different ethnic groups is an interesting one. The first visualization shows the broader picture of how the white race has a lower level education than African Americans or Filipinos but this visual allows the viewer to see things closely. The breakdown of the birthplaces shows how little of an education these people received but yet still came out on top. This can still be seen today; a great deal of businesses such as restaurants, shopping places and small convenience stores are owned by Italians, Spaniards and other people from Europe in general. Seldom are there stores that are strictly African American owned or owned by individuals that did not qualify as being Caucasian. Both visuals show the benefits of being Caucasian and what it means to be superior to others.
Argumentation
As previously stated, the 1940 census is made up of a variation numbers such as dates of birth and texts such as names and whether an individual owned their home or was educated. This information allows viewers of the census to piece together lives of the people in the census and to get a sense of what these people did daily back then. From the information provided, many conclusions can be drawn. One of the conclusions is that mostly men were the head of the household, most women did not work but some did, and men and women went to school but men received higher paying jobs than women. These conclusions are just some of many that can be gathered from the census by taking a quick glance. Although initially the census seems to provide a great deal of information, there are some other relationships between the data that needs more looking into and requires past knowledge.
Education, as mentioned, is always seen as an important aspect of how well off an individual will be, the type of job they will hold and if that job will be able to provide for the person and family members. The level of education someone is able to reach holds much value and the value of it directly correlates with many other aspects of someone’s life. However, often times, there are a group of people (usually a particular race or ethnicity) who receive a good education and are still unable to provide for their family or are working lower paying jobs than others. They are looked over when it comes to promotions and often have their work ethic attributed to something other than them simply working hard. This can be seen in the 1940 census; the census shows that most of the people on it received some sort of education. The educational levels ranges from elementary school to a four year college degree or beyond. As previously stated, most of the men and women had an education but the men received higher paying jobs and this was also the case when it came to whites and blacks.
Looking at the census with all the different data, it is difficult to see what correlates with one another and what does not. Creating different visuals allows the viewer to see if there are causations, patterns or correlations between the information provided. The census divides into three races: Filipino, Negro and White. Upon taking an initial look, the division of the census into three races is unclear. The data shows that there are races but being that there are many names, it is hard to parse out the different races. The census itself also does not show the division of the educational level that each race has reached. The correlation between race, educational level, average income and the value of the homes they lived in is not clear until different visuals of presenting the data were created. In order to make these relationships clear a scatter plot was created. The educational levels are broken down into three groups with different colors so that the differentiation can be made; red is college or higher, purple is high school and green is elementary.
Carefully looking at the plot, the assumption that white privilege has its place in the relationships seen between the previous categories noted is made. The plot shows that there were a group of whites that received an elementary school education and the average value of their homes was about 2,074 dollars and average income was 238 dollars. There were also group of blacks that received a college education or higher and the average value of their homes and average income was less than that of the whites. The same conclusion is made pertaining to Filipinos and whites, the Filipinos highest educational level is college or higher and the average value of their homes and income is less than whites and less than the blacks as well. For years, other races have had to work twice as hard, if not harder, to get decent paying jobs, whereas whites are sometimes allocated the privilege of not having to go through as much hardships but still being able to reap the benefits.
To ensure that white privilege was indeed at play, the scatter plot was looked at again and a second set of information in the white section was provided. The highest level of education that whites received was a high school education; this means that both blacks and Filipinos went on to receive college degrees in different fields whereas whites did not. Based on previous information, the assumption that although the highest level of education reached by whites was high school, they would still have a higher income and their homes would be of a higher value was made and was correct. For a white person with a high school education, the average value of their home was 1,585 dollars and average income was 227 dollars. The scatter plot also provided an interesting find. A white person with just an elementary school education had a lower average income than one with a high school education, although not by much, but their homes were worth more than another white person with a high school education. The census does not make why that is clear but further research may be able to provide an answer to that. Although that interesting observation was there, the fact still remained that their homes were worth more and incomes were higher compared to the other two races despite of their minimal level of education.
The 1940 census shows a trend of white privilege that have been there since the beginning of time. Whites across the world have felt superior to others and their superiority complex has led them to acquire lands, wealth and even people. The census shows that for these other two races, although they have worked hard and have reached high levels of educational achievement, it means almost nothing in the end. They worked jobs such as cooks and laundry personnel, and are being passed on the jobs that they may be able to use their degrees in. Whites were able to acquire jobs such as administrators, treasurers and accounting clerks despite their educational shortcomings all because they were not black or Filipino.
Process Documentation
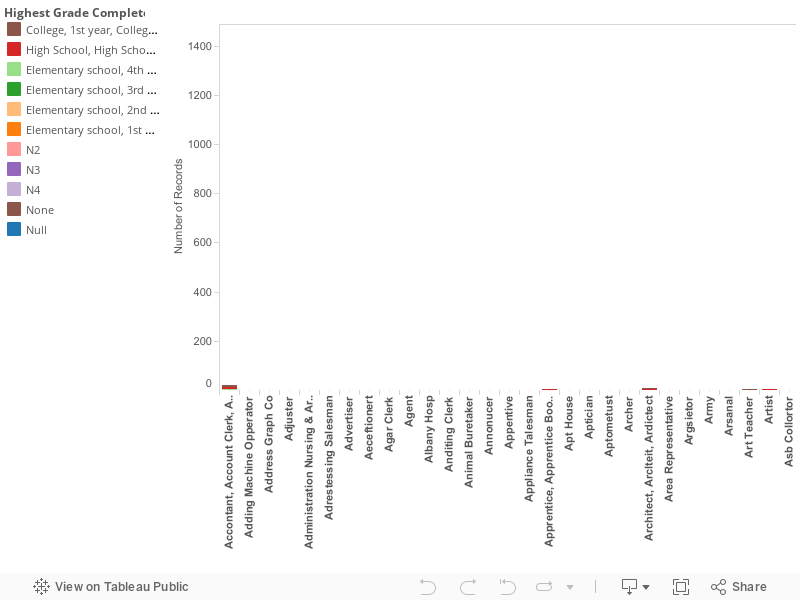
In order to ensure that the viewer understands the correlation between education and race and how that plays a role in how much someone’s home is worth or how much money they are paid, the visuals used need to properly connect with the stories told and the argument made. In the beginning, a bar chart was created to show the different occupations that people held and the level of education that went hand in hand with these occupations. However, a further study of the census and prior knowledge showed that there was more to the story than simply schooling and work. The bar chart, although useful, did not tell the entire story. In order for patterns to be seen and correlations to be made, the two visuals (scatter plot & symbol map) were developed.
The scatter plot was created in order to really break down the information given in the census. The census is filled with an extensive amount of information, which makes scrolling all the way through difficult. Due to this, it is hard to see right away that there are different races in the census. The scatter plot was able to make that visible. After the races were determined, I then decided what kind of correlations I wanted the viewer to see. I decided that I wanted to make a connection between education and race and how those two things played a role in the lives of the people in the census. I proceeded to group the levels of education together. Elementary was from grades one through five and a little beyond, high school from freshman to senior year and college from freshman year to senior year and beyond. I chose three colors to differentiate between the levels of education: green (elementary), purple (high school), and red (college). The color differentiation allows the viewer to know what level of education they are looking at without having to read or try to figure it out for themselves. I then decided to try to see if there was a correlation between the level of education an individual had and how that may or may not play a role in how much money they made and how much their home was worth. I placed the value of home in the columns section, and race and income in the row section. This gave me all the information I needed and helped create the correlation I was looking for. The end result was race determined how these people lived. Although education was important, their race made or broke their wealth and well-being.
For my second visualization, I decided to make a symbol map. The map was needed to break things down even further. The scatter plot broke up the information in the census by race but I wanted to see if there was any correlation in ethnicities. The questions I wanted to answer was whether or not different ethnic groups within the Caucasian race received different levels of education and which ethnic groups were more educated. To create the map, I needed to have a geo dimension, which in this case would be the birthplaces of the people in the census. I then proceeded to add the highest grade completed to my map. As with the scatter plot, I grouped the grades together and used the same colors (green, red and purple) to differentiate between the three levels of education. I used the same colors because I did not want to cause the viewer any confusion and also to give the viewer the option of drawing his or her own conclusions from these two visuals. After placing my measure and dimensions where they needed to be, the map was created. Upon completion, I was able to see the different ethnic groups that were higher in numbers in Albany in the 1940s and their levels of education. The map allowed me to see that there some whites that received a college education but there were very few. This new information caused me to wonder about other things the census and the visuals I created left unanswered.
Further Research Questions
The two visuals and the overall census helped answer a few questions about the people that lived in Albany in 1940. The questions they help to answer are the basic demographic information, the race of these people, the average value of their home and average income according to level of education and race. These questions are important because these people played a role in the history of Albany. The visuals shows how race plays a role in other aspects in someone’s life and that this correlation is a pattern that people are noticing more as further research is done. A few things that the census nor the visualizations answer are why the scatter plot does not show the college education that Caucasians received, even though this information was visible on the map. Are these ethnic groups considered something else or was this something that the software failed to pick up on? Another question that is not answered is whether race played a role in determining where the people lived, did race or ethnic group separate them subconsciously and, lastly, did an individual’s level of education determine what job they held. In present time, someone’s education level helps to determine if they will receive a particular job or not or what level of the job the person will be in. In the 1940 census, it is determined that race played a role in many aspects, but does race also play a role in a specific field someone is in?
Although the census does not answer these questions, there are ways that the answers can be found. In order to find the answers I am looking for, I will have to dig deeper into the lives of the people in the census as well as the city of Albany. I may be able to find the answers if I do further research on the different groups that lived in Albany and find patterns on the types of jobs they held in order to discover whether or not the different groups lived close to one another by choice or by force. I proceed on finding this information by visiting the New York State archives, which can possibly provide me with additional censuses and material about people in Albany throughout the years. I can also use google to find this information as well as research sites such as JSTOR to find whether articles have been written about Albany during this time period. Another way I can go about finding the answers I need is speaking with Albany natives. Often times, I find that asking people questions leads me to learn information that I would not find in a book, article or on the internet. Many individuals have families that came to Albany from all over and may have information and knowledge about events, places and other people that has not been transcribed. Talking to be people sometimes proves to be the most valuable asset needed in order to find what is being looked for.
Censuses provide information that is needed to help a city prosper and continue on. It provides government officials with valuable information to make decisions but, most importantly, it provides historians and other researchers with information that we may not be able to collect ourselves. History is based on past events and people. Therefore, without data, such as those provided from censuses, some of the research we do would be more difficult. The 1940 census provides information that led to questions about race, education, ethnicity, well-being and other aspects of people’s lives being raised. It answered some questions and left some unanswered, which prompts further research. The further research that is needed can provide us with answers to additional questions and allow us to look closer at the lives of people in 1940 and additional years. The visuals created helped to break down the information, which was needed for further understanding. Overall, the knowledge gained from the census and visuals is one that is important and proves true and relevant to aspects of things that take place today. It shows how true the saying “history repeats itself” is.
Bibliography
“Demographics of New York.” Wikipedia, the Free Encyclopedia, April 30, 2016. https://en.wikipedia.org/w/index.php?title=Demographics_of_New_York&oldid=717934581.