Example map embed

To create a map with Google Maps:

  • Include five potential locations for your walking tour. Make sure your locations are arranged in a logical order so that your visitor doesn’t need to double back or walk over highways (hint: use the “Walking” option instead of “Driving”!)
  • Your tour must be walkable in an hour or less according to Google’s estimate
  • Once you have a route, click Details and look for an icon of three connected dots in the upper right (the Share icon)
  • In the popup, select Embed Map and copy the iframe code in the box.
  • On the course website, create a new Post (you’ll need to log in to the course site and find “Add new post” on the right side of the dashboard)
  • In the editor for your post, select the Text option on the upper right
  • Paste in your iframe text
  • Switch back into the Visual side—your map is a gray box, this is ok! It will display properly after you publish.

HW: Intro to working with Data

This will be easier if you read the two assigned readings first!

Edited to add: #ERR and #REF errors are errors–they mean that your function is mistyped or your range is incorrect.  #NUM errors are ok in median cells–it just means you’re trying to find the median of zero, which is nothing.

  1. Copy the original” spreadsheet into a new sheet in drive.google.com. Call your first sheet original
  2. (if you need to stop and come back to it later, you can access your sheet by logging into your google account and finding it in drive.google.com)
  3. Create 7 new sheets in your workbook and title them white-only households, only white men, only white women, households with slaves, only “other free persons”, only non-slaves
  4. Use the filter function to display only the households in each category (hint: use the empty/not-empty/none options). For example, to select only households with slaves, you would need to filter “slaves” to not-empty. To select only households of “other free persons,” you would need to filter all other categories to empty and “other free persons” to NONE.
  5. When you have each category filtered, click the intersection of the column and row labels to select all, or use CTRL+A to select all. Copy and paste your filtered households into the relevant sheet.
  6. Repeat for other categories
  7. On your original sheet, SUM the number of people in each household in the blue column to the far right. You MUST do this with a function—don’t enter the number by hand! Remember that when you type your function you can select your range by dragging, or you can type in your range: ie, SUM(A2:G2) will add up all numbers from column A cell 2 to column G cell 2.
  8. Copy your functions by selecting and dragging where you want them to copy.
  9. Don’t forget to SUM all households and find the MEDIAN household size at the bottom of the column!
  10. At the bottom of the original sheet, do the same for each category of people: find the SUM, the MEDIAN, and the COUNT.
  11. Do steps 6-9 on each of your filtered category sheets – make sure to make row and column labels for each since you didn’t copy and paste those!
  12. Create one more sheet and name it medians. Copy the template in the example workbook here
  13. The blue cells should be filled with functions. DO NOT HAND ENTER NUMBERS. For each household type and category, write a function to find the median of each person-type in each household type. For example, to find the median of “free white males under 16” in all households, you would write =median(total!B2:D761). B2:D761 is your range of cells, and your sheet name is separated from your cells by an exclamation mark. You can also type your function, ie, =median(, and after you type the parenthases, click on the sheet you wish to select from and select your range of cells by dragging.
  14. Note that the medians for the free white categories male and female should include more than one column from the original sheet! Be careful with your ranges!
  15. Once you have all your medians written in the median sheet, select all on your median sheet, and go to insert>chart
  16. In the Chart Types tab, make sure that “Aggregate Column A,” “Use row 1 as headers” and “Use column A as labels” are selected.
  17. Hit Insert chart, send Dr. Kane the workbook using the Share link in the upper right (mkane2@email.com)

HW: Digital History project reviews (due 2/9)

For Tuesday’s homework, choose two of the projects below and explore (I recommend one from 1-5 and one from 6-10).  You don’t need to try to see every single page or item in the project, but click around enough to get a sense of what the project is about.

  1. UAlbany Campus Buildings Historical Tour
  2. The Normal School Company & Normal School Company History
  3. State Street Stories
  4. Black and Free
  5. Valley of the Shadow
  6. Arabella Chapman Project
  7. Mapping Segregation
  8. Digital Harlem
  9. The Negro Traveler’s Green Book
  10. Visualizing Emancipation

In your comment below, discuss:

  • Who is the audience for each of your two projects?  How can you tell?  Is the audience more specific than “people interested in history” or “people interested in African American history”?
  • What kind of interactivity is there?  Think back to our discussion and reading about social media.  How do you as the visitor interact with the project besides just reading it?  Do your two projects differ in the kind of interactivity they allow?
  • Did you have any frustrations in navigating or trying to interact with the project?  If you came across the project outside of a class, how would your frustrations have affected the amount of time you spent on that website?
  • Reply to another student who discussed one of the same projects you selected, and discuss any similarities or differences you experienced with the project’s interactivity or your frustrations with it.

HW: Wikipedia talk pages (due 2/4)

In class on Tuesday, we’re going to start building a timeline of Albany history using Wikipedia as a starting reference.  For the homework due on Thursday February 4, choose two of the Wikipedia pages from our timeline (links available either through the spreadsheet we edited or under the images in the timeline itself).

Investigate the Wikipedia articles’ Talk pages–these are accessible through the Talk tab at the top of each article.  Remember that we are not talking about the Article portion of the Wikipedia page!

Screen Shot 2016-01-29 at 2.43.23 PM

Comment below and discuss:

  1. What are the major points of discussion on the Talk page?  For example, in the War of 1812 Talk page, there is a conflict over whether to characterize America, Canada or Britain as the aggressor in the war.  How do users on the Talk page attempt to resolve these disputes?
  2. Do your example Talk pages illustrate any of the concerns in today’s reading (The Historian’s Craft, Popular Memory, and Wikipedia by Robert Wolff)?
  3. Remember that your comments are graded on correct grammar, spelling and punctuation.
  4. One point of extra credit (one point max) if you’re the first person to post about a page no one else has mentioned yet.
  5. Reply to one other student’s post about the similarities between what was discussed on your Talk pages and what the other student describes in theirs.  You’ll lose one point off of ten if you don’t make a comment replying to another student!

HW: Where does history live on the web? (due 2/2)

Note that there is a new category of posts available on the sidebar to the right; all our homework posts will be available under the category homework.

For the homework due on Tuesday February 2, find two history-related accounts on two social media networks (for example, two accounts on Twitter and two accounts on Tumblr).  Think broadly about what history-related might mean; some examples include the MedievalPOC tumblr, CivilWarLive livetweeting of the Civil War, the Every3Minutes slave sales twitter assigned for today, or the Brooklyn Museum’s collection tweeting bot.

Remember that we are not looking for traditional websites like the NY Public Library’s digital collections–the central feature of social media is that it is interactive and many users may have an account within the same network.  We are also not looking for single history-related posts; the entire account must be history-related.

(You may use one of these examples, but only one–you must find an additional three accounts on your own!  You may not use the twitter accounts referenced in our reading It’s History, Not a Viral Feed, for reasons discussed in the reading.  One point of extra credit if you’re the first to post an account, maximum one point.)

In your comment below, link the accounts you found, and briefly describe:

  1. What’s the purpose and audience of each account?  How do other users interact with the account, if at all?
  2. How does each account use the interactive features of its network?  How do your two examples from the same network differ from their use of the network’s interactivity features?
  3. Make a connection between your accounts and at least one of the readings assigned for today (It’s History, Not a Viral Feed by Sarah Werner; Digitisation’s Most Wanted by Melissa Terras; and Slave Sales on Twitter by Caleb McDaniel).  Remember that it is polite to refer to authors by their last names, not their first names!
  4. You will be graded on your use of correct capitalization, spelling and grammar.  Writing professionally on the internet is how we present ourselves professionally, like wearing professional clothes for a job interview.

You must also reply to at least one other student’s comment and discuss how your examples differ from the other student’s examples.  Your reply is part of your grade for the assignment and not leaving a reply will deduct one point out of ten from your final score for the assignment.

Putting Humanities Data to Work

Today’s readings (minus the video):

How to manage all this data?

Images for reuse?

Where’s the print screen/screenshot button?

printscreen

Post Guidelines

Screen Shot 2016-01-26 at 1.39.15 PM

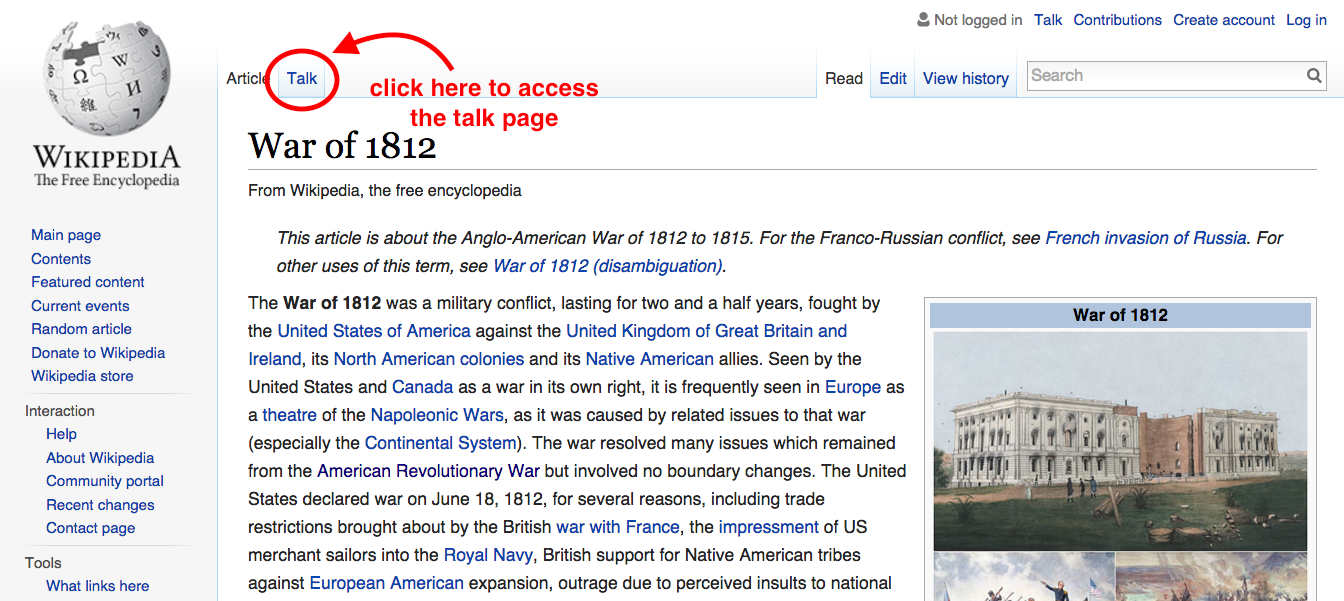
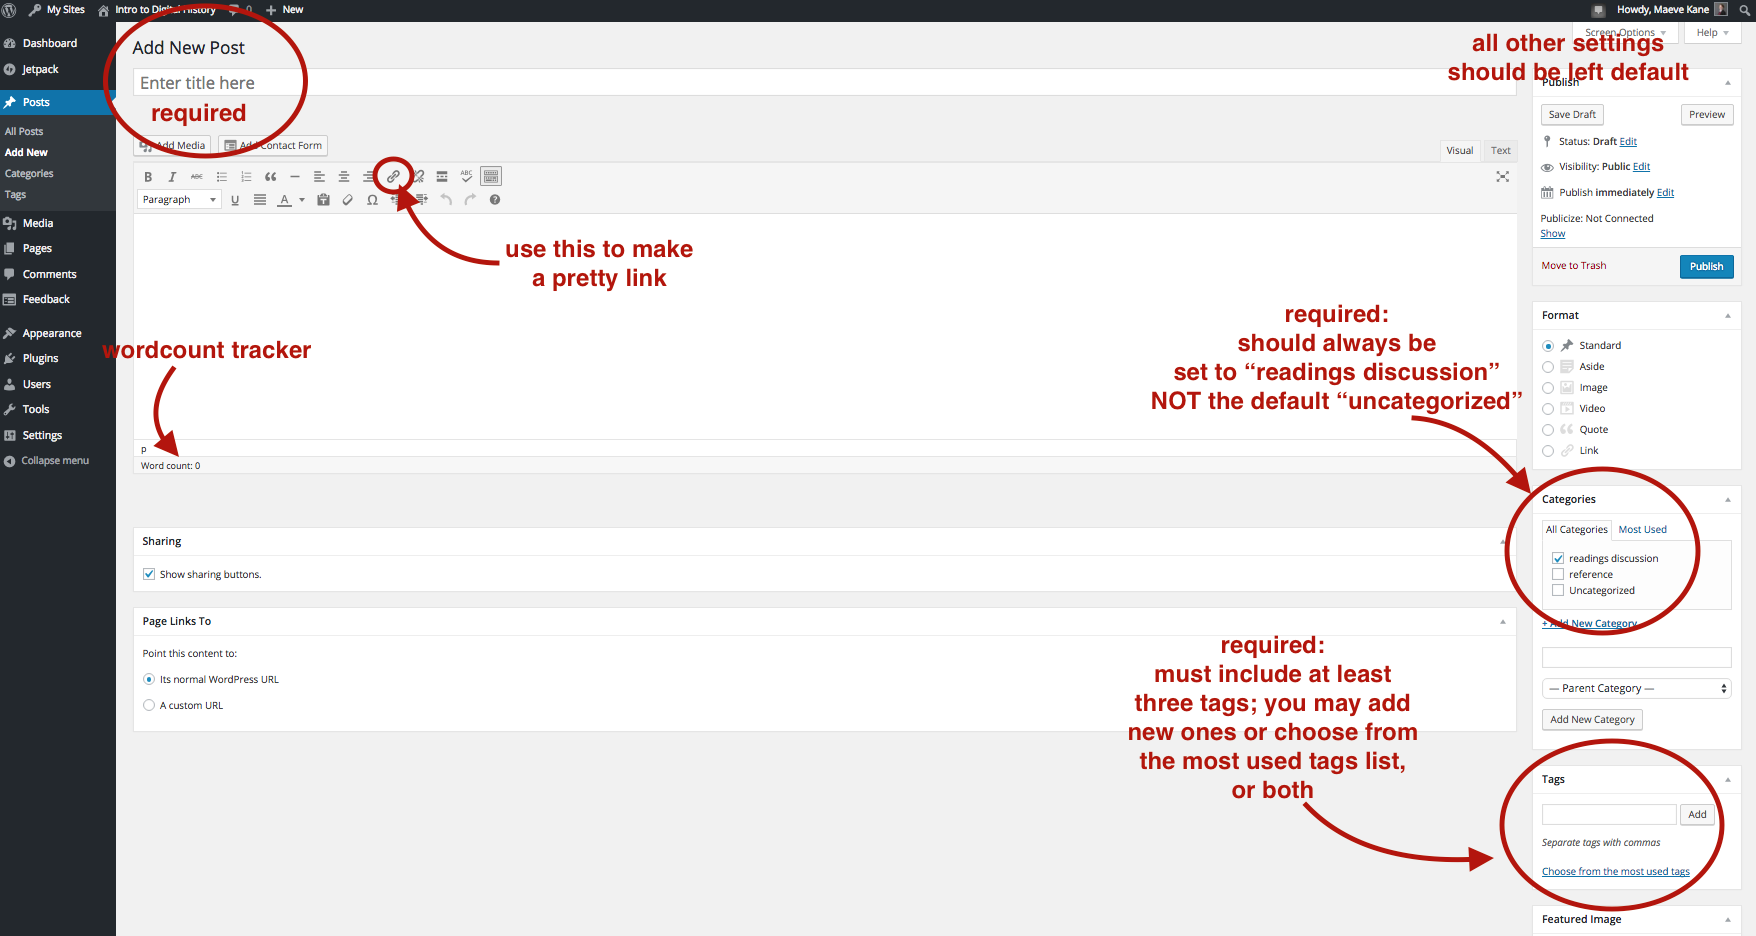
To post on your assigned day, you must be logged in to the course site; posting options are available on the far left of the dashboard space under “Add New.”  The posting schedule is available as a PDF on Blackboard.  You may also start a post and save it as a draft to finish later without publishing; you are the only one who can edit your posts.  You don’t need to include your name or “by XYZ” in the text of your post, as your username will appear under the title once it’s published.

Posts should be about 500-800 words long (longer is ok too) and must be posted by noon the day before the assigned class meeting. Posts must be in complete sentences and you will be graded on correct punctuation and grammar.  There is a word count tally at the bottom of the post box if you’re unsure about length.  Your post should synthesize for the class the major points of the assigned readings and assume that the audience (your classmates) have already read the assigned readings.  On days that we have how to readings assigned, summarize the purpose of the tools.  Be sure to think about your post as a very small essay; it should have an introduction, conclusion and paragraph breaks to indicate topic shifts as well as transition language between points so that your change of topic is clear to the reader.

The assigned readings should be linked in the text as you discuss them with “pretty links.”  Merely dropping in a url address like this: http://ahis290.maevekane.net/ instead of making a pretty link like this will lose one point.  To make a pretty link, type the text you wish to link, highlight it with your cursor, and click the little link icon in the formatting options bar.

Posts must include three discussion questions about the assigned readings and have a title–try to choose a title that is descriptive and ties together the thematic points of your summary.  Posts should also be set to the “readings discussion” category so that the course site stays easy to navigate as we add more things to it throughout the semester.  You must also add at least three tags (think of this as the metadata for your post).  What are your readings about?  Are your questions about the technical aspects or the thematic aspects (ie, wordpress vs. economic history).

For your discussion questions, do NOT pose yes/no questions.  Think big with how and why questions–why did a historic event happen, how does displaying information in certain ways affect the viewer’s understanding of it, why would someone use a tool, how is the tool limited, etc.  You’re also welcome to post clarification questions–how does a tool work, how do I make it do X?  Think about the discussion questions as a way of guiding what you want to talk about and cover in class that day.

You may, but you are not required to, include images in your posts.  You can do this with the “Add Media” button on the upper left, which will let you upload an image from your computer and then position it in the text.

When finished, hit the blue Publish button on the top right.  If you’re not finished, you can hit the “Save Draft” button above publish, in which case your saved post will appear in the list of “All Posts” on the far left of the dashboard when you want to come back to it.

You may compose the text of your post in an offline writing program, but be aware that software like Word sometimes includes strange formatting when you copy and paste in the post field.  To avoid this, right click in the post field and select “Paste and Match Style.”

Posts will be graded on a 10 point scale based on your organization, grammar, links to readings, synthesis of the readings, and mechanics like pretty links, tags, categories and questions.