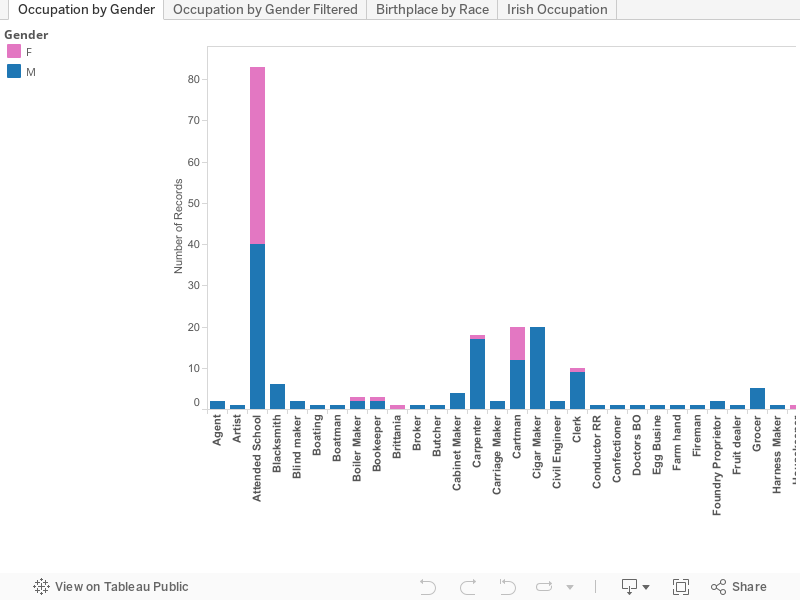
The first two graphs that I made for my dataset show the difference in occupation between genders. Many occupations at this time were exclusive, or nearly exclusive, to a single gender. Males usually had what would be considered skilled jobs, such as laborers or blacksmiths. Some of these jobs would still have a woman or two though and this surprised me when making these graphs. Women had other jobs that were exclusive to them. These would be jobs like sewing or a servant. The only three listed occupations that were about even were attending school and being a tailor or tailoress. Attending school makes sense because it consists of mainly children who were attending school during the time of the census, but tailor and tailoress and school teacher were more of a surprise. I do not know which gender I would have assumed as taking the gender role for a tailor or school teacher, but I was surprised to see that it was evenly distributed. When looking through the jobs filtered by gender I was not surprised to see men had what were known as skilled jobs during this period and women had more traditional female jobs in the sense of serving and sewing. When you look into the history of women you really begin to see them emerge in jobs outside of the norm during wartime when they are necessary to the workforce. During the 1920’s you also begin to see more independent women start to join the workforce in job roles that were not totally normal at the time. My understanding was that this was when women began to come into their own in the workforce and even during this time it was still tough for women to get jobs. This is why I was surprised to see that some women in Albany in 1860 were already assuming some skilled position jobs. When looking through the graph you will see that, while dominated by men, women have a small population in occupations like laborer, carpenter and boilermaker. In a paper by Shannon Banaszak titled “Women in the Workforce: Before 1900” it is stated that although economic historians agree that there is a steady influx of women into the workforce between 1800 and 1900 that there is a drop from twenty percent to fifteen percent between 1860 and 1870. Due to my prior knowledge of wartime and the roaring twenties being the time for women to shine in the workforce paired with this data from Banaszak I was very surprised to find women appearing in skilled jobs during this time period in Albany history. Banazsak does go on to state that women actually were beginning to become a big part of the workforce, really beginning to take off in 1840, which was surprising to me. She does state the jobs they had were normally sewing or domestic service. (Banaszak) This information correlates with my graph and census. In the grand scheme of the workforce women played a larger role than I would have expected, but apparently it was becoming a normal occurrence during this time for women to enter the workforce.
The next graph that I would like to point attention to is birthplace by race. There is little records outside of the white race in the sample of the 1860 Albany Census that I was looking at, but I made this graph originally to see if there was a difference between the five other recorded races and the white race. A huge percentage of the white race was coming from New York and I was curious if this was the case with the black and mulatto sections of the census. Besides one black man coming from Pennsylvania, all other persons of color in the census come from New York, which keeps with the trend of the rest of the census. It made sense that New York would be the number one place that people were coming from considering that it is an Albany census, but what came as a surprise to me was the amount of people that were from Ireland in the census. It is second to New York by a lot, but it is the next highest percentage by far. Out of the one thousand people in the sample of the census I was looking at six hundred and twenty four people came from New York and two hundred and eleven came from Ireland. The next highest number is twenty-four from England. This made me wonder if this was unique to Albany or if Irish immigrants were this popular throughout America in 1860. Upon further research I found that during the 1800s more than half of the Irish population came over to America. The article called Irish and German Immigration states that this was true in Ireland and Germany due to many hardships and unemployment. Immigration to America would total in over seven and a half million coming to the United States between 1820 and 1870. About a third of that was from Ireland. This rush of immigrants from Ireland and Germany had major effects on every city in America. (Irish and German Immigration) After reading about the influx of Irish immigrants into America during the time period that this census was taken it made a lot more sense why the Irish population in Albany was higher than any other by far. After doing this research and finding out that a major reason that they immigrated was trouble finding any work in their native land I decided to make a graph to look at the Irish population of Albany’s place in the workforce. I had read in the same article I referenced earlier that Irish immigrants would do a lot of jobs that labor-intensive all over the United States. This was true in Albany as well. The most popular job among Irish immigrants in Albany was a general laborer. I read a letter while doing research about the Irish immigration that was written from an immigrant to an Irish national stating that he was happy in America and although he loved Ireland he recommended everyone move during these tough times and come over to America for a better chance at life. He spoke of the famine. I did some other research and found that the main source of income for Irish nationals was too farm potatoes. Even when this business was doing well it was low income. When there was a five-year famine in the late 1840’s it caused starvation and killed many, which played the largest factor in driving many to immigrate to America. (Famine Wiki) Even when the famine was over in the 1850’s immigrants would write their family to join them for a better life. This is what led to the huge immigration numbers to major cities all across America. Due to the huge influx during this time period there are currently more Irish Americans in the United States than there are Irish Nationals in Ireland. Cities all over America served as refuge for Irish natives and Albany was a spot where Irish could come to get a job and live out their life.
Sources:
http://www.oswego.edu/Documents/wac/Dens%27%20Awards,%202013/Banaszak,%20Shannon.pdf
http://www.ushistory.org/us/25f.asp
https://en.wikipedia.org/wiki/Great_Famine_(Ireland)
Some general writing comments: you use a lot of “would” or “would be,” which are passive verbs which weaken your argument and make your sentences harder to follow, like we talked about at midterm for the walking tours. You also jump topics within your paragraphs–the first, for example, jumps from occupation to occupation and to school with little transition between sentences. This makes your argument difficult to follow and feels disjointed. You have some organization with respect to talking about occupations broadly, but even within a topic or paragraph you need to organize your ideas and transition between them so that your reader can follow you clearly.
You should also break up your big paragraphs into smaller paragraphs to help with this–beginning with “When looking through the jobs,” and “During the 1920’s” you’re onto a completely new topic, and the latter part of the paragraph jumps between time periods.
When discussing another author’s argument (Banazsak), make sure that you use their full name the first time they’re mentioned. Last name only is ok after that. Very good use of outside research to contextualize your data.
When discussing racial groups, try to avoid language like “the white race”–it’s very 19th century, old fashioned language, and has some really negative connotations in modern use. Instead of “A huge percentage of the white race,” try “Many Albany whites,” or white people.
Remember that even in places where you’re not directly quoting, like in the Irish section towards the end, you need to cite your source. This goes for the immigrant letter as well, and make sure that any time you use related material like this, that you tie it strongly back to your data or main topic so that the reader understands how and why it’s related to your central argument.
Remember that the final version must have complete Chicago style citations. See here: http://www.chicagomanualofstyle.org/tools_citationguide.html for how to cite websites.
In “Birthplace by Race,” it might be interesting to see your data with NY excluded, if you’re looking at foreign place of birth. “Occupation by Gender” might be interesting to sort the occupations by number of people (right click on occupation in the columns area and hit sort) to help make your largest occupations easier to compare.