The nineteen forty Albany census provides us predecessors to get a more statistical point of view of what society was like back then. Although it does not give us individual accounts of those who lived during this time period, it does tell us what age they were in nineteen forty, what state or foreign country they lived in five years prior to nineteen forty and even what level of education they completed. These numbers and data allows us to understand a lot of the city’s trends based off of what jobs people had, how much money they made at these jobs and what level of education was required to acquire those jobs and make a desirable salary within those jobs. It is tough to read all of these random words and letters, therefore we visual the data through program like Tableau to make the data easier to read and also not as boring or unappealing to read.
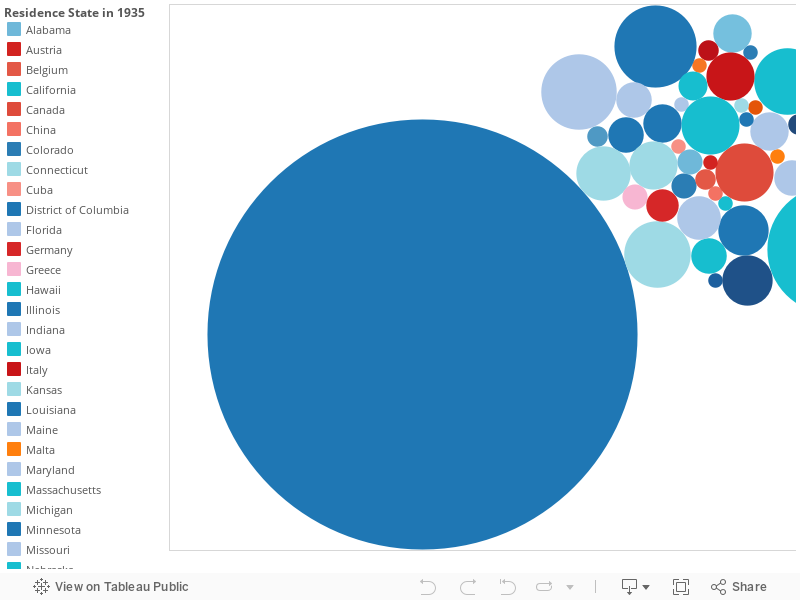
One of the data visualizations I have put together involve the resident’s home state or country as of the year nine thirty-five, which is only five years prior to nine forty. This visualization is a graph of circles that vary in size based upon the number of residents that resided in a specific state or foreign country five year prior to the census being taken. These circles also vary in color based on whether the entity is a state within the United States or if the circles represents a foreign country. Foreign countries are colored some shake of red while states are colored some shade of blue. This visualization depicts that a lot more of new residents to Albany came from neighboring states such as New England, New Jersey and Pennsylvania. The foreign countries take back seat to states that are further away from New York, meaning that foreign countries had the least amount of people migrating to the United States. I feel that this is a very likely trend due to the time period. The United States had just been recovering from the worst economic situation this country has ever seen; The Great Depression. Foreigners obviously heard about the news of the poor economic conditions of the United States and most of them decided to stay where they were. Immigration to the United States was wildly popular prior to the Great Depression because they wanted to be free and believe in their own religions without getting punished by the governing system. Also, immigrants were attracted to moving to the United States because they felt it was the best economic decision they could make. It is still a cliché phrase; “The American Dream”. Immigrants wanted to get a well-paying job, buy a house with a white fence all while raising a family. Once the idea of a well-paying job feel through the cracks, the large sum of potential immigrants did not see the appeal that was once there. With that being said, Albany might not be the most attractive spot for immigrants to relocate to in the first place, but the capital city of the state that most immigrants were arriving in might attract more of said immigrants once they arrived at Ellis Island. If such a small amount of immigrants were immigrating to the capital of the empire state, then it leads me to believe that the national trend stays consistent with the trend of Albany.
The census is a good source to investigate into what type of social and economic trends occurred during a specific time period. Based upon the information given within the nineteen forty census I was able to make the information given a little easier to read and understand through using a visualization and through this visualization it is much easier to make an assumption about the conditions of Albany during the year nineteen forty and the surrounding years as well.