Text II

For this week’s readings, we are continuing to look at historical documents that use visualizations to help understand the content presented.

Mining the Dispatch is a website created by Robert Nelson to explore dramatic and traumatic changes in the social and political field of the Civil War era. The time frames of the information follow the same from the Richmond Daily Dispatch (November 1860 – April 1865). The site uses software such as MALLET, a generator that filters topics through documents. Some of the topics include: slaver, nationalism, military conflict, soldiers, economy, and politics. There’s the ability to adjust graphs/charts in each topic, showing the progression over time.

NYT Chronicle is a site that allows you to enter a word or phrase into the search engine. The line graph presented will show a percentage or raw number of the times the word/phrase has been features in an article.

Voyant is a database that allows you to upload a website and breaks it down into segment. Once broken down, it does look confusing to the eye because the site is moved into sections of frequencies, summaries, and numbers of terms. It is more statistical than helpful to understand the content.

With majority of us doing the census/visualization as our final project, looking at how these sites break down historical information is helpful. Mining the Dispatch is the most helpful in that it still includes information about all the topics in the Civil War era and you’re able to read, while assessing the graph. The New York Times Chronicle is a good way to get people interested in how frequent something has been said. It is however, not very exclusive if you were doing research on a particular topic. There are many times that a word can be featured in an article as just a word, while the article can have a different main idea. This can raise a question of is the information you want your audience to search meaningful or just a fun visual? The Chronicle is similar to another data visualization site, Twittearth which shows live tweets on a 3D globe. You’re able to see live tweets and suggestions on who to follow. This is an example of a visual that would fit to support any information presented about social media or Twitter statistics. It has more focus than The Chronicle because although it focuses on one newspaper, The New York Times covers several topics. Voyant is a database that seems necessary for when you need to assess a website that is difficult to understand and need to simplify it.

In comparison to Tableau, how can other data visualization sites work to your advantage for displaying information?

In what ways can visualizations help understand historical information?

Which visuals attract a certain audience? How do you decide how to use these visuals?


Using Spatial History to Make a New Way of Seeing Maps (and History)

My topic for this discussion was maps but the articles I read for this discussion have to do with the use of computers to create spatial history. In the article “What is Spatial History?” Richard White presents the possibility of using computers to see history in a different way. He argues for the use of spatial history, which is literally seeing the same textual history in a new way. The main differences between spatial history and normal history White tells that:
Spatial history uses computers for collaborative work to tell larger historical stories.
It is mainly visual representations rather than text.
The use of computers is necessary.
It’s open ended and can be changed over time.
The focus is on space.

When White talks about space, he means in the most simplest way maps. It’s more complicated than that but essentially space here is the visual representation of a geographic area, which is best presented as maps. So in turn spatial history is presenting historical information and data on maps and other visual representations of space to tell a larger historical story. When history and maps are then combined, history then becomes more than just a story of an event, but the story of event over an area and over time. It becomes the history of a place through a certain time.

Spatial history is created, according to Richard White, through three different forms of space. These forms aren’t completely different and work together to create his idea of spatial history. There is spatial practice, which is human movement across locations. Then there’s representations of space, which is the visual representation of space. This would be normally a map or layout of buildings that show how we represent space. Finally there’s representational space, which is the space that has symbolic association or something is lived and experienced. White best explains this confusing concept as a religious building like a church. Something that is part of physical space but is also experienced or symbolic. When working in together and in tandem, these forms of space can best show a maps or visual areas history.

So then, when it comes to presenting spatial history, White looks to computers and new technology. Specifically GIS, a program that upon first glance may just seem like Google Earth, but is in fact a sophisticated way to layer information on a real world map. GIS’s ability to visually layer information over images of the real world make it a prime tool for the creation of spatial history. Geographic and historical maps, lines and data points can be overlaid on real world images to create a historical story in the real world. The best example presented in the article were sample layers on the history of Rio de Janeiro between the 1840s and 1870s. Over a real world image they added four layers:
A historical map of Rio de Janeiro
A digital street layer with geocoded addresses.
A layer showing property value contours
A 3D contour map of the hills of Rio de Janeiro
All together when laid over a geographic image of Rio de Janeiro, they create a detailed image of the city during the mid 1800’s and the property values of the cities buildings. It then becomes more than just a detailed map though, it creates a number of stories about the city, depending on what you’re looking for. All of the sudden it tells the stories of the various classes of Rio de Janeiro, where the live, and with more research how they lived.

With the idea of greater research we come to Whites final important point. He makes a point to note that spatial history is not just the creation of maps or visual images, but a means of doing research. He argues that the using spatial history to create these images creates new questions about history that otherwise would go unnoticed in normal textual history. That spatial history can reveal new information and ideas about the past that regular history couldn’t.

The second article, titled “Western Railroads and Eastern Capital: Regional Networks on Railroad Boards of Directors, 1872-1894”, is an example of spatial history at work. Given only a small three paragraph introduction about the nature of Eastern Boards of Directors controlling Western Railroad Companies, you are then thrown into a visual story. Your given a map of the United States that has been color coded based on a geographic area. Clicking on a specific geographic area reveals a plethora of information on that area’s relate to the topic. For example, clicking on New York (on the map it’s New York, New Jersey and Connecticut) reveals a network map of New York Directors to their corresponding Railroad Companies, a bar graph showing the number of New York Directors for each year between 1872 and 1894, and finally extra textual information on the most important New York Directors. In this sense, the map of the United States becomes not only a means of dividing the country into different areas, but a way of telling each area’s story in the greater topic presented. In turn when all the area’s stories are combined it hopes to make a full story of the control by rich men in the East over railroad companies on the West.

So after reading these articles I have three questions that I think would be good for discussion.

1.Does spatial history seem like a good way of telling an entire story or idea of history, or does it seem more like a visual way of backing up (or inspiring) a textual story?
2.Would spatial history be an easy way to teach history to younger generations or is it too complicated and only useful for historians?
3.Do you think spatial history will be accepted by most historians or is the regular way of presenting history too ingrained?

Data Visualization Readings and Analysis

(Mentioned in Post)

Each of the articles that I’ll be discussing are all connected by one thing –visual data. Since we’re in a digital history and class and most of us don’t have the longest attention spans –visualizing data can be an easy way out as oppose to looking at spreadsheets. However, is the grass really greener on the other side?
The main point in “How to Lie with Data Visualization” was that regardless of what the cold, hard numbers are, people and corporations can lie through the visuals associated with statistics –as its title insinuates. Though people are obligated to post the true statistics, they make negative statistics work in their favor through the way it is presented visually. For example, turning the y-axis on a graph upside down, making it seems as if numbers are decreasing while they’re doing no such thing –as in the gun control example. As a result of this tactic, it would seem that at a glance after Florida’s ’Stand Your Ground Law’, the amount of gun deaths plummeted dramatically. However, the exact opposite happened but in moving the y-axis the creators of this graph succeeded in deceiving viewers.
Ben Jones’ article (based on William Zinsser’s book) touches on 7 different points that concern non-fiction writing tips, as well as those regarding visual data. The first point that he makes regarding “The Transaction”. In other words, this is the reflection of how a creator of a visualization feels about the set of data onto the set of data itself. This was illustrated very vividly in the video included in the article. I found that the creator of this visualization is very focused on the impact of deaths as a result of guns. The creator didn’t use a conventional graph, but single, slim straw like curves so that the impact of the amount of gun deaths will truly be seen by its viewers. Not only are the amounts of gun deaths and age ranges made visual, but the years of those lives that were lost as well. This provides a different perspective as oppose to the conventional bar graph. That wouldn’t show how many years are lost in such deaths.
One of the most profound points made in the “On Visualizing Data Well” was exhibited in “How to Lie with Data Visualization”. According to Ben Jones, the humanity of the visualizer and their views are reflected in what they create. For example, in Ravi Parikh’s article, one of his examples included how people are deceived by bar graphs –such as the one attached displaying baseball stats. In this case, what John Theibault was saying regarding visualization is proven true: it’s used to quickly identify patterns in large datasets during the research process. However, what happens when data visualization is deceitful? According to Parikh, “We’re wired to misinterpret the data”. For example, in a deceitful pie chart with slices of 60%, 63% and 70%, clearly the person behind this data set used the wrong graph because these three amounts do not amount to 100% collectively. This makes viewers think that candidates (in this example) are closer or further in the race than they appear.

Why do you think some people/companies use deceitful visual data?
Would you rather to simply see statistics as oppose to visual data?
What are some examples of visual data that we see in every day culture? (Commercials, for example)

Northern Free Blacks Occupational Patterns and Housing Patterns

The reading assigned this week entitled Northern Free Blacks Occupational Patterns and Housing Patterns illustrated the harsh treatment that free African Americans endured during the nineteenth century. Although African Americans were considered to be free, they remained socially stagnant. Freedom did not result in having equal rights to the superior race. In fact, African Americans had little to no rights. They faced occupational and residential limitations that hindered them from really being liberated.

Northern Free Blacks Occupational Patterns and Housing Patterns provided its readers with several examples of occupational limitations. One of them being a legislation prohibited free African Americans to obtain a liquor license. Because of this, African Americans were unable to open grocery stores. Southern governments feared that free African Americans wold give gin to African American slaves and that would result in rising up against their masters. One could only imagine how that could put a dent in African American employment. In 1837 residents of Baltimore petitioned for a legislation to prevent African Americans from participating in trades. Unfortunately, for them, they were denied. But when the president of the Mechanical Association of Cincinnati accepted an African American apprentice, he was tried before the society.

The article also shared that landlords during the nineteenth century were not optimistic about having African Americans as tenants. They preferred to rent to whites. In 1830, an African American family tried to move to a white community in Boston. Residents were furious nd threatened to destroy the house. African Americans were simply not accepted in society. The Pennsylvania Society for the Abolition of Slavery 1838 directory gathered that of the 612 African Americans that were listed, 133 of them loved in alleys, courts, and rear building. Of the ones who weren’t forced to live in alleys, they lived in overcrowded houses.

African American may have been free according to the law, but they were still treated unjust and still remained in a captive environment. They were not allowed to progress in society. It was made sure that the superior race had no competitors when searching for a job and a home.

Questions
1. Imagine you were a free black person during the nineteenth century in the city of Louisville, how else would you attempt to make a living? Do you think rising above the occupational limitations presented were possible back then?

2. How do you feel about the term “free blacks”? Were they really free? Do you think the treatment that free blacks endured contradicts the term “free blacks”?

3. Explain why landlords during that time period refuse to accept black tenants?

Northern Free Black Occupational Patterns and Housing Patterns

The reading for this week was The Northern Free Black Occupational and Housing Patterns. There were two sections of the reading, the employment and the housing of free African-Americans in urban cities.  The overall goal of the reading was to highlight the injustice and the segregation that free blacks faced both economically and socially during the 19th century.

The first section of the reading focuses on the role urban cities played in the life of African-Americans. Urban cities represented the heart of economic activity and during the 19th century if anyone was seeking work opportunities there best chances were in the cities, but that was not the case for many free African-Americans. The difficulties the black community faced when seeking work opportunities were due to the legal segregation between whites and blacks. For instance, the reading  gave us examples of how states would pass legislators that would hinder an African-Americans economic enterprise. One example was prohibiting free blacks from obtaining a liquor licence. As a result, blacks could not own grocery stores because a grocery was usually considered the source of selling liquor. This shows how one law could affect the black community in multiple ways. Another goal of the reading was to show the devaluing of many blacks. For example, blacks whose occupation were doctors or dentists were not recorded in the census as having professional careers but rather as cabinet makers or barbers. Unfortunately, this shows that many free blacks were neither recognized for their hard work nor successful at always getting the jobs they wanted. However, in many southern cities at least more than one half of blacks were finding occupation in jobs that were promising economic advances than in northern cities like Albany, where less than one-half of blacks were finding the same type of jobs.

The second half of the reading was about the housing condition of African-Americans.  Two reasons for their  living condition were landlords would rather rent to a white family or they would refuse to have black tenants. Many of this type of discriminatory attitude were often seen outside of the designated black districts. The reading states that some  African-American had to live in alleys, courts or in the back of buildings and they struggled to keep a clean/healthy home. In places such as Albany in the 1830’s the worst location had the cheapest building and was near the Capitol, it was home to both the blacks and the poor whites. Another point the reading makes is the difference  between the amount of blacks in a home vs. the amount listed in the directory. For example, in Albany four or more blacks who shared the same address would be recorded as one. These incomplete data would present a disadvantage when trying to look at black residential patterns in antebellum cities, but could also be an advantage when looking at head of households rather than the whole population.

The reading shows the obstacles African-Americans faced when trying to gain economic prosperity and the ways in which different cities would enact legislation to hinder blacks. Ultimately, resulted in the limiting of black employment and  benefiting gained by their white competitors. The reading also discusses the living condition of the black districts which often varied from city to city, but either way the bigger the city the more likely African-Americans were confined to smaller badly maintained homes.

Questions

  1. Why were their more job opportunity in southern cities than in northern cities?
  2. Why was there a disproportion in the number of African-American in a home vs. the number listed in the directory?
  3. How might living in only black districts affect African-Americans?


Being Black is Complicated

Often times when people talk and think about slavery, the conversation is centered around the slaves that were in the South and not as much as the African-Americans that were in the North. Although there were not many slaves in the North, there were some. Due to the way the North is “built” (less agriculture), there were not too many slaves but African-Americans did work as servants and other work of that nature. The story that is told about African-Americans not only talks about them as slaves but also as a people who needed saving from themselves. It is seldom that one reads a story about African-Americans and the story is told in a good light, in a way that does not make these people seem as if they did not know how to live and how to be human prior to being taken captive. Many scholars have written about this particular topic and just like with anything else, there are those that tell the story of the bad effects that being held captive had on the slaves and then there are some that believe slavery helped these people who were going nowhere fast.

In the reading, it talks about how long it took people to acknowledge blacks as historical victims, what that suggests is that prior to World War 2, blacks were not known as victims but they may have been known as people who needed to be taken care of and shown how to live. The reading begins by talking about two scholars by the names of Kenneth Stampp and Stanley Elkins. Stampp talked about the harshness of slavery, he brought to people’s attention that slavery was not just this system of trying to help another fellow human being but it was an institution that was destroying another race; three years after Elkins, expanded on this and also brought to people’s attention that slavery caused not only physical but psychological damage to those that experienced it. These two scholars were able to put to rest the idea that slavery was justified but in doing so, a new picture was painted. The picture that was painted was of African-Americans as powerless and victims of oppression by whites.

Many people began to write about the after effects that Slavery had on blacks and how this can be seen in how blacks behave and live their lives today. One particular author by the name of Moynihan wrote about how he believed that because slaves were so dependent on their masters, modern African-Americans are now dependent as well, they depend on others to care for them instead of caring for themselves; he went on to say that “the white America broke the will of the Negro people” and made the assumption that blacks were now ashamed of being black and black heritage had been lost. These  assumptions made by Moynihan prompted studies by others to try to figure out if what he was saying was true, were blacks too dependent?, were they broken? and had the heritage really been lost?, these questions were burning in the minds of many.

Years and years of studies have been done trying debunk this idea that blacks were helpless and victims. The studies talked about blacks as abolitionist, and focused on those in the North. Many of these  studies were focused on blacks that lived in the North and some of the contributions that they made. In one study, emphasis was placed on the ability of blacks to gather together to create a course of action and to implement it, and although the study found that blacks were divided and some saw themselves as powerless they were still indeed active and articulate; this showed that if blacks were able to receive the help they needed they would be prosperous.  Further studies  brought about similar results, showing that blacks were more than capable of being a people of substance and people who can contribute greatly to society. Kenneth Kusmer has suggested a framework that could help others better understand and study African-American life in the North post civil war and even now, he states that internal,external and structural forces all play a role in shaping urban life; he states that viewing free black communities this way will help others to understand how complex it is to be apart of these neighborhoods, how complex it is to always be talked down on and how complex it is to come out of bondage and oppression and try to prosper.

Questions

  1. What other connections can be made between how modern African-Americans behave and slavery?
  2. Why do you think that blacks in the North were divided?
  3. What other forces do you think helped to shape black urban life?


Various types of Visualization methods

Remember the good ‘ole days of sitting in your third grade classroom and drawing bar graphs and pie chart? The information that we were recording were fun things such as the number of boys versus girls in the class or the various hair colors. Since then, the amount of information we have learned to work with and analyze has expanded exponentially. We literally have a world of information available with a simple Google search. But with all this wild and crazy information that we are so fortunate to look at, a problem arises when there is simply too much. Who wants to sift through pages and pages of surveys to find relationships when you could simply graph them. Maybe a pie chart or a bar graph will be sufficient enough. What if I was to tell you that there are hundreds and thousands of various graphing models available, each specializing in certain fields?

First thing’s first, why do we like to graph information? Research has shown that humans are more keen to identify patterns and relationships visually through color, shape and style, to name a few. This is why graphs play such an important function of data analysis. Unfortunately, not all graphing techniques are ideal for every field of study. While a pie chart and bar graph work great for finding relationships between the population of Albany, a stem-and-leaf plot might not be a good choice. Jeffrey Heer, Michael Bostock, and Vadim Ogievetsky of Stanford University conveniently compiled a list of the more interesting and complex graphing styles. I won’t explore each graph but will instead discuss the few we are all familiar with and a couple of the wild ones.

let us first look at the stock market! We can all recognize that iconic rising and plunging chart that displays the growth and decline of various stocks. This particular chart allows the user to scroll through time and watch how various stocks saw immense growth or loss periods. For example we can see that Apple, in a single month, from June to July in 2006 had a loss factor of over one hundred percent. Protovis is one such program that allows a user to create an interactive, “live”, graph. Unfortunately, it is no longer in development as of 2011, shortly after this article was written.

Out of all the various types of graphs and charts, maps are probably what most of us feel the most comfortable with. If you have ever watched your local six o’clock news you probably have seen Choropleth Maps. These are useful to display the various temperatures across a country using light and dark colors. In this particular map we can look at the obesity rates in the United States. Flow Maps are useful in visualizing a number of important statistics on a map. In this case we are looking at Napoleon’s march on Moscow in 1812. Not only can a large visual be created to overlap the map to depict the route used to travel, but also troop sizes, temperatures, latitudes and longitudes and recurring lesson of never to invade Russia during the winter.

I would like to pose the following questions for us to consider:

1.) Which type of visualization represented in this article, or others not mentioned, do you feel is ideal for historians?

2.) How can we effectively use any of the visualizations mentioned to expand our Walking Tour projects?

3.) As a follow-up question to the previous one: Thinking of our intended audience, how would one particular graph be clearer than another?

The Benefits of Using Digital Sources The Correct Way

Digital Sources are any kind of information that is encoded into machine-readable content and they have opened up a whole new set of opportunities and perspectives for historians in terms of historical analysis. Digital history and research can help us understand the patterns of history on a large-scale basis better than more subjective individual accounts like archives. Digital sources can offer tons of information and statistics about the collective group that we call society. Non-digital sources like archives or encyclopedias can be used to better understand more specific accounts such as what it was like to be on a ship in the 1700’s. Digital sources are best suited for more statistical history research such as the unemployment rate of a country during a specific interval of time. Using this can lead to a better understanding of the conditions of the economy of that country as a whole rather than researching into one or a few accounts. The major points of Schmidt’s essays consist of why digital humanities should spend more time focusing on larger trends in history rather than individual stories even though this is an unpopular idea, and what needs to be done in order to humanize the way we research using digital data.

Schmidt expresses the idea that digital history and data are much more useful to historians and their research if it does not focus as much attention on subjective accounts. If you want to better understand specific statistical changes than it is more efficient to use an account that is focused on the entire group of individuals because it offers many more perspectives which leads to more accurate research and Schmidt stresses the importance is using digital history correctly, meaning using the general, non-subjective digital sources because it will lead to the most optimal analysis. Although this idea is seen as “dehumanizing” Schmidt makes the case that his idea is less dehumanizing than forcing a history that is centered on the collective group to pretend that individual actors could or did make the difference. This is highly unlikely and therefore it only makes sense that less individuality in digital history is beneficial to historian’s research and understanding.

Schmidt feels there are three things that need too be done in order to make digital history more humanized and that is adding a filter on the information that gets digitized so we can know what information is reliable, reformulating the information into a more understandable format and finally finding ways to relate to the context. In doing these things, it eliminates the bias within digital history and narrows information down to the most vital and useful information.

Schmidt’s correct way of utilizing digital history is an unpopular opinion, but it makes sense that if we exploit digital sources and non-digital sources and use them to their strengths than it limits the amount of bias information and enhances the research historians do. The humane thing to do would be to limit the amount of bias we have in our information because it leads to a better comprehension of our history.

Why is it that individual accounts are not as useful in digital history?

Why does Schmidt suggest reformulating the content of digital history into a more meaningful form but his work is very difficult to read?

Why does reformulating the content of digital history help us understand it better in some cases?

Digitizing of Historical Texts and the possible role of Optical Character Recognition in that process

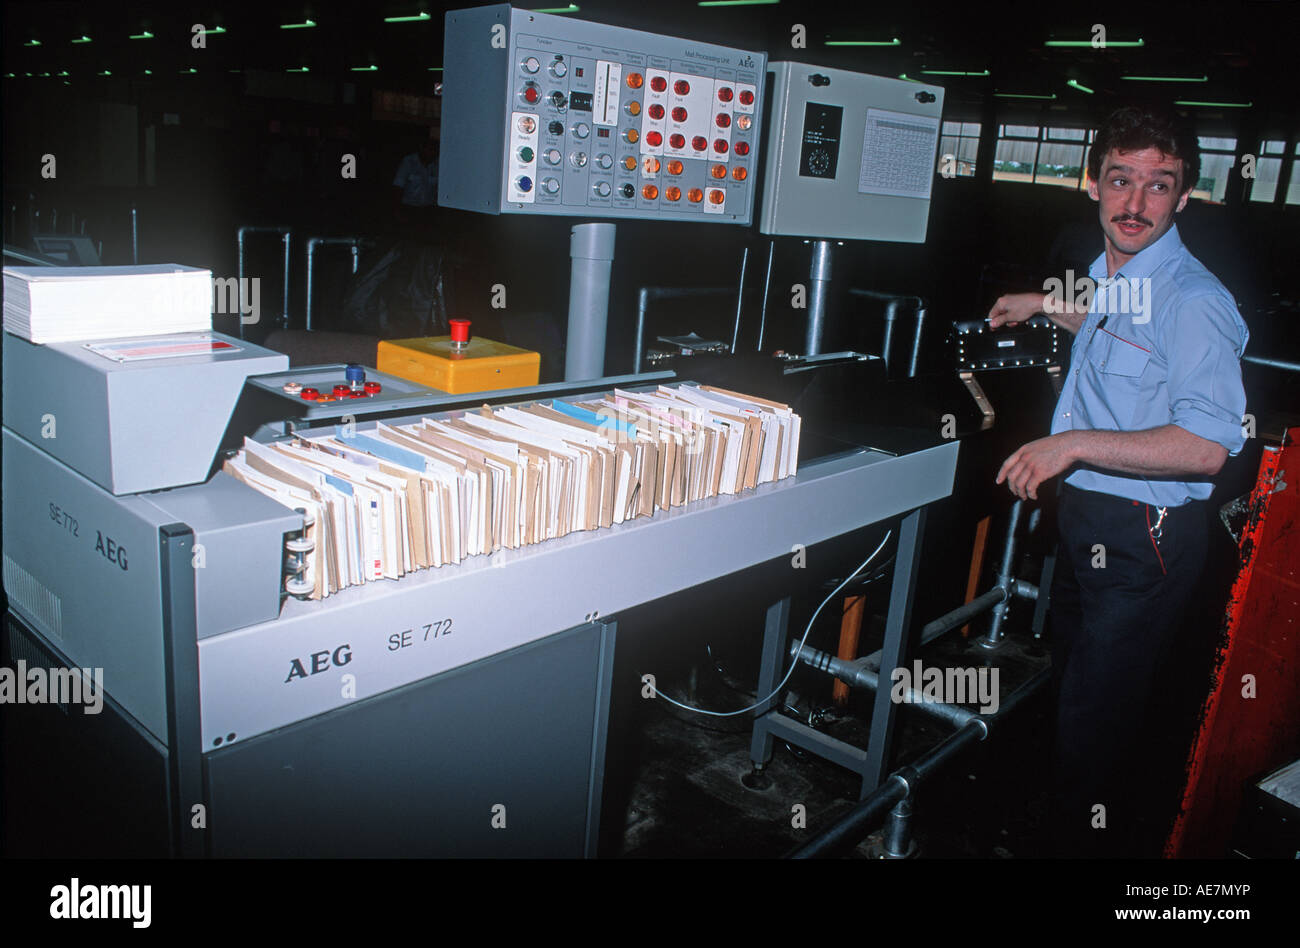
We had two assigned readings for class on Tuesday. These readings were “How does OCR document scanning work?” by Chris Woodford and “Is Digitizing Historical Texts a Bad Idea?” by Mills. First I would like to discuss the article by Woodford. Woodford gets into OCR or Optical Character Recognition. Optical Character Recognition in simple terms is a program that computers use to view printed text in an easier format. It allows for your computer to recognize printed text. There are two basic ways for OCR to work. The options are Pattern Recognition or Feature Detection. Pattern recognition works to see the pattern of letters and feature detection looks for things such as strokes of handwriting when writing the letter. OCR is a very useful tool. Using it you can almost always at least get a decent guess at what is written. Even if someone with extremely sloppy handwriting is writing a message OCR may be able to decode it using pattern recognition and feature recognition. It simplifies this process even further if you have some background information on what the person may have been trying to say. OCR was invented earlier than I would have thought for sure. It’s roots date all the way back to 1928.

How Does OCR Scanning Work? by Chris Woodford

Postal Worker controlling OCR letter scanner.

In our next reading by Mills the topic is digitizing of historical texts. His main point seems to be that if we digitize texts they lose some of the connection in general. He spoke about how he was showing some students an old book and while they were not excited to start with they became intrigued by the book and by the end enjoyed the whole experience. Would this have happened if he had shown them a digitized version of the same book? While the answer may have been no, there is also an argument on the other side of the spectrum. There are a lot of advantages do digitizing texts. The main advantage is the audience you can reach with digitized text expands greatly. Mills and his colleagues debate over this topic for what he describes as a few weeks and he himself is still unsure while writing this article which way he is siding with. I believe the pros outweigh the cons in digitizing historical texts. In my opinion, digitizing historical texts is beneficial because it opens the text up to a way larger range of people and it becomes easier to access and sometimes even to read. The only argument, although it is a big one, to not digitize historical texts is that it takes away from the physical aspect and the historical connection that the text contains. This is a good point, but I sway towards digitizing these texts.

Is Digitizing Historical Texts a Bad Idea? by Mills

Codex from the book that Mills showed his students.

These two articles are very much intertwined. The OCR article speaks about computers being able to detect handwriting and digitize it and the second article speaks about the debate over digitizing historical texts. If you side with me on the discussion about digitizing historical texts than Optical Character Recognition seems to be a great tool that may be able to be used in the process of digitizing historical texts. In our homework for this week we have to transcribe part of an old Albany census. There are certainly going to be some names that we are not sure about when we are reading the census. An OCR machine may be able to pick up on patterns in writing that we are not able to and digitize this text for us, but it also may not. Also our homework is another good example of why digitizing historical texts is necessary. Us transcribing the census into print makes for a way better resource than the original because it will be easier to get the content even if it takes away from the historical connection.

Questions I would like to pose:

1: Do you think that Optical Character Recognition is reliable and a good source for transcribing?

2: The obvious question of this write-up, do you think it is a good idea to digitize historical texts?

3: Do you think that Optical Character Recognition could play a part in the digitizing of historical texts?