Final proposal

The Title:
The Albany Muster Rolls of the 8th Militia.

The Data Set:
The data set of the Albany Muster Roll of the 8th Militia includes the name of each enlisting Soldier, when the soldier enlisted, the soldiers age, where the soldier was born, the soldier’s trade prior to enlisting, the company the soldier belonged to, the soldier’s rank, the soldiers stature, and the soldiers descriptive qualities that included: complexion, eye color, and hair color, and lastly the volume/page the soldier’s name was found on. The Albany Muster Roll of the 8th Militia has both descriptive,and numeric data within its data set. The data within the data set that can be considered descriptive includes the following:the occupation or the trade of the soldier enlisting in the Militia, where the enlisting soldier originally came from (that ranges from places such as Germany, to Connecticut), the soldiers ranking in the Militia (Lieutenant, Captain, Private, etc), as well as the soldiers physical attributes such as eye color ( blue, brown, etc), complexion (brown, fair, swarthy), and hair color (brown, black, fair). The Albany Muster Rolls of the 8th Militia can also be considered numerical data. The data sets includes the following: the age of every soldier entering the Militia, as well as the date that each soldier enlisted. The range of the numerical data for the ages is the minimum age of 16, and foreseeably the maximum age of 58. The range of enlistment date is from the beginning of april 1760, to the end of june 1762, three years prior to the breakout of the American Revolution.

Three Relationships or Comparisons:
The first comparison in the data set of the Albany Muster Rolls of the 8th Militia is if the data set can show a connect between the trades of the enlisting soldiers to the actual rank they received in the Militia. From my brief inspection of the data sets it seems plausible that soldiers who before they enlisted worked as labourers, carpenters, or maintained a blue collar type of trade became Captains, but there are outliers, where for example, a baker also became a Captain.
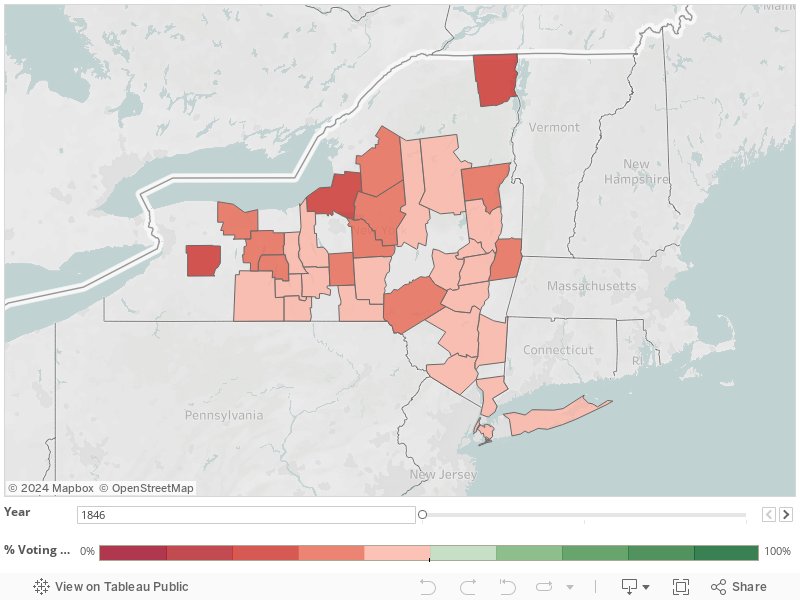
The second relationship in the data set of the Albany Muster Rolls of the 8th Militia is which homeland or state received the most male enlistments in Albany during the two years between 1760 through 1762. More specifically does the majority of men from certain homelands outweigh others because of migration patterns prior to 1760 through 1762.
The third relationship in the data set of the Albany Muster Rolls of the 8th Militia is whether race, ethnicity or the enlisted complexion (dark, swarthy, fair, negro, pale, ruddy, etc.) of the soldier also affected the rank he was able to achieve. I would also like to look at how the age of the enlisting soldiers to their rank in the 8th Militia.

The first location on my walking tour is the Henry Johnson Memorial that is located in the park. The statue is to commemorate the Albany hero. (Van Buren, Lori. “Sgt. Henry Johnson Closer to Medal of Honor.” Times Union. Accessed March 30, 2016. http://www.timesunion.com/local/article/Sgt-Henry-Johnson-closer-to-Medal-of-Honor-5712963.php.)


My second location of the tour is the bridge located in the park. The bridge has been erected over the lake since 1875. (“Washington Park Lake.” Wikipedia. Accessed March 31, 2016. https://en.wikipedia.org/wiki/Washington_Park_Lake.)


Third location on the walking tour is lake that is located in Washington park. It is said that the lake is 1600 feet lond and 140 feet wide. (“Washington Park Lake.” Wikipedia. Accessed March 31, 2016. https://en.wikipedia.org/wiki/Washington_Park_Lake.)


The fourth location is the park playhouse. It was founded in the late 80’s and provides free outdoor entertainment in the park. (“Our History.” Park Playhouse. Accessed March 31, 2016. http://www.parkplayhouse.com/history/.)


The fifth location on the tour is the “king Memorial Fountain”.  This is one of Albany’s best known yet least understood landmarks in Albany. (“The Moses Fountain in Washington Park.” All Over Albany. Accessed March 31, 2016. http://alloveralbany.com/archive/2011/04/18/the-moses-fountain-in-washington-park.)

It is estimated that my walking tour will take 15 minutes.

The overall theme of this walking tour is to inform not only the tourist but even the locals about the history of Washington Park. There are a lot of people who are unaware of how historic Washington Park actually is and what historical landmarks that reside there in the park. The audience for this tour can range anywhere from children to adults, and being that the tour is estimated at 15 minutes it will be easier for children to complete with a lower chance of getting bored or distracted and it will be easier for the elderly to complete as well. Anyone who is interested in the history of Washington Park can be directed as the audience. The 5 locations are related because for starters they are all located in the same general area.  Washington park is the housing location for all 5 of the locations so it makes it difficult to not complete the tour. Another way they are related is because of their historic value. Some of these locations date all the way back to the 1800’s while it seems the most recent dates back to the late 80’s. Another thing that all these locations have in common is that they attract people and pique the curiosity of many people, both tourist and local.

Moses

Henry Johnson Statue


Three research questions that need to be found are what location is the most historic out of the others, what location is the most popular and what location has a deeper story.

Data Visualization Readings and Analysis

(Mentioned in Post)

Each of the articles that I’ll be discussing are all connected by one thing –visual data. Since we’re in a digital history and class and most of us don’t have the longest attention spans –visualizing data can be an easy way out as oppose to looking at spreadsheets. However, is the grass really greener on the other side?
The main point in “How to Lie with Data Visualization” was that regardless of what the cold, hard numbers are, people and corporations can lie through the visuals associated with statistics –as its title insinuates. Though people are obligated to post the true statistics, they make negative statistics work in their favor through the way it is presented visually. For example, turning the y-axis on a graph upside down, making it seems as if numbers are decreasing while they’re doing no such thing –as in the gun control example. As a result of this tactic, it would seem that at a glance after Florida’s ’Stand Your Ground Law’, the amount of gun deaths plummeted dramatically. However, the exact opposite happened but in moving the y-axis the creators of this graph succeeded in deceiving viewers.
Ben Jones’ article (based on William Zinsser’s book) touches on 7 different points that concern non-fiction writing tips, as well as those regarding visual data. The first point that he makes regarding “The Transaction”. In other words, this is the reflection of how a creator of a visualization feels about the set of data onto the set of data itself. This was illustrated very vividly in the video included in the article. I found that the creator of this visualization is very focused on the impact of deaths as a result of guns. The creator didn’t use a conventional graph, but single, slim straw like curves so that the impact of the amount of gun deaths will truly be seen by its viewers. Not only are the amounts of gun deaths and age ranges made visual, but the years of those lives that were lost as well. This provides a different perspective as oppose to the conventional bar graph. That wouldn’t show how many years are lost in such deaths.
One of the most profound points made in the “On Visualizing Data Well” was exhibited in “How to Lie with Data Visualization”. According to Ben Jones, the humanity of the visualizer and their views are reflected in what they create. For example, in Ravi Parikh’s article, one of his examples included how people are deceived by bar graphs –such as the one attached displaying baseball stats. In this case, what John Theibault was saying regarding visualization is proven true: it’s used to quickly identify patterns in large datasets during the research process. However, what happens when data visualization is deceitful? According to Parikh, “We’re wired to misinterpret the data”. For example, in a deceitful pie chart with slices of 60%, 63% and 70%, clearly the person behind this data set used the wrong graph because these three amounts do not amount to 100% collectively. This makes viewers think that candidates (in this example) are closer or further in the race than they appear.

Why do you think some people/companies use deceitful visual data?
Would you rather to simply see statistics as oppose to visual data?
What are some examples of visual data that we see in every day culture? (Commercials, for example)

Importance of Visualizations

The three articles that were assigned all had to do with different aspects of visualization. The first article, “On Visualizing Data Well” written by Ben Jones, compares a book that William Zinser wrote about how to be a good writer to visualizations.  The second article, “Visualizations and Historical Arguments”, written by John Theibault, goes over history of visualizations as well as problems that are commonly encountered. The third article “How to Lie with Data Visualization”, written by Ravi Rarikh, shows how you have to watch how you interpret visualization that you come across because they can be very misleading.

William Zinser wrote an inspiring book “On Writing Well” and had it published in 1976. This book was a classic guide to writing nonfiction. Inspired by Zinser, Ben Jones writes the first article, “On Visualizing Data Well”, to discuss 7 principles of creating visualizations. The seven principles that he uses include transaction, simplicity, clutter, style, the audience, words, and usage. Jones compares each one of the principles in his article to principles that Zinser’s came up with in his book. The first principle, transaction, shows that “the product that any writer has to sell is not the subject being written about, but who he or she is.” (Zinser, 1976) It is important for the reader to feel the emotions of the person who created it. The second principle is simplicity, which means don’t over complicate the message. The next principle is clutter, which means to only use what is useful and nothing more. The fourth principle, style, is to create a data visualization that is both clear and beautiful. The fifth principle is the audience. This principle shows that you need to create for yourself, and not for an audience. This sixth principle is words, which basically says that you should avoid cheap and made up words that are cliché, by caring deeply about the words you use. Lastly, the seventh principle is usage. This is where you determine whether the information should be “ushered in” as an accepted practice, or “thrown out on [its] ear”.

“Visualizations and Historical Arguments” goes over how visualizations slowly integrated into the lives of almost everyone today. An idea that started off as just mainly being used by mathematicians and social scientists, is now being used by every field, including history. John Theibault states that the two most important dimensions of visualizations are density and transparency. Density is how much information can be stored in a small space, and transparency is how easy it is to understand the data shown. Visualizations are used to enhance presentation of arguments, as well as a means of quickly identifying patterns in a large data set. From the early 1900’s to now, visualizations have dramatically changed, making it more feasible to fit more information into a much smaller area of space. An example of this would be animated visualizations and interact with the reader as they more their cursor around different areas on the screen. Also, color coding different sections of information is an easy way to give more information without having to go into great detail about it.  One of the challenges of historians using visualizations in their work is to “align the rhetoric with the audience’s ability to follow it”. Authors who use visualizations must understand how much background the reader has in order for them to interoperate what they are seeing. The very beginning of statistical analysis began with SPSS and SAS, which made doing so a lot easier. From there, the concept continued to grow, and still continues to grow today. The realm of visualizing information is still expanding today. An important point that Theibault made was that today’s historians will have to accustom themselves to reading network diagrams as well as they do regular maps and diagrams.

The third article “How to Lie with Data Visualization” went over three different ways that visualizations can be very misleading. The first was that Ravi discussed is Truncated Y-axis. Most of the time when you look at a chart, the Y-axis starts at zero and goes to the highest value. To mislead people into thinking that differences are a lot larger than they are, the writer can manipulate the Y-axis to look very dramatic. The second way that visualizations are misleading is with cumulative graphs. Instead of showing the important information over a long period of time, the writer can “zoom in” on the data and only show a portion of data, which gives the misleading idea that things are going well, when in fact they are not. The third way, ignoring conventions, is misleading because it violates standard practices. It goes beyond what you are used to seeing. For example, a pie chart that goes past 100%.

Visualizations have become very common when it comes to showing large amounts of data in a small amount of space. They make it easier to process a lot of information at a much faster pace. They can be very informative or misleading. They can be quick to understand, or very confusing. Hopefully as time goes on, and more people learn how to correctly read and understand visualizations, the less problems that will be encountered.


Questions:

  1. Have you ever seen a visualization that was very misleading? What was it about?
  2. What do you believe that the future of visualizations entails?
  3. What did you think about the seven principles that were presented in the first article?

Northern Free Blacks; The Scholarly Discussion.


The Northern Free Blacks; The scholarly discussion reading begins during the American Revolution. Thousands of Northern slaves won their freedom through their service in the continental army, and by the second half of the nineteenth century slavery had become a largely Southern institution. In the North a Free Black society began to take shape, and although most of them were denied full citizenship they still became a force in politics. Never the less Historians stand on two sides of the slavery line. Some Historians painted slavery in the light of moral and intellectual guidance imposed on an uncivilized group of people, as other Historians showed slavery as an undeniable form of evil injustice.

The Northern Free Blacks; the scholarly discussion illustrates how two scholars, Kenneth Stampp and Stanley Elkins, fully discredited the racial justifications of slavery by earlier scholars because of the closed minded system people were brought up in during that era. Elkins compared the manipulation to accept the concept of slavery to the manipulation of the Germans to hate the Jewish population. Daniel Patrick Moynihan and his coauthor Nathan Glazer took a different approach to the issue of slavery concluding that white oppression ultimately lead to the the destroying of the African American culture specifically in New York City. Moynihan and Glazer stated that with the loss of their culture, the African Americans of New York City then lost their values that needed to be guarded and protected and pushed them into becoming dependent and more content with others solving their problems for them. The last scholar I’m going to mention is William Ryan, a psychologist, who claimed that “blaming the victim” was attributing to the failure of African Americans. Ryan stated that the African American community, specifically men, were unable to take advantage of the benefits America had to offer. William Ryan’s discussion prompted scholars to research slave communities, the impact of white supremacy, the free African American community before the civil war, and if the heritage of the African Americans had truly been broken.

Throughout the years studies by many scholars have attempted to analyze how slavery truly affected the African American community and their culture. These studies have included Black Activism within the Black Abolitionist community, Ex-Slaves, Freeborn’s , and so on. Many of these studies showed the formation that black activist used with white reformists to fight against the institutions of slavery, while others tried to show the dynamics of the African American community life, all with in the Northern states, and if they could be considered contributing member of society.Lastly, other studies conducted showed the division and unifying issues with the African American community, which still considered that little is known about.

Questions:

Do you think the effects of slavery can still be attributed to the still very real issue of racism in America today?

Do those who were not subjected to slavery have the voice to proclaim what slavery can do to a person?

What types of issues could have caused division in the African American community before the civil war?

Northern Free Blacks Occupational Patterns and Housing Patterns

The reading assigned this week entitled Northern Free Blacks Occupational Patterns and Housing Patterns illustrated the harsh treatment that free African Americans endured during the nineteenth century. Although African Americans were considered to be free, they remained socially stagnant. Freedom did not result in having equal rights to the superior race. In fact, African Americans had little to no rights. They faced occupational and residential limitations that hindered them from really being liberated.

Northern Free Blacks Occupational Patterns and Housing Patterns provided its readers with several examples of occupational limitations. One of them being a legislation prohibited free African Americans to obtain a liquor license. Because of this, African Americans were unable to open grocery stores. Southern governments feared that free African Americans wold give gin to African American slaves and that would result in rising up against their masters. One could only imagine how that could put a dent in African American employment. In 1837 residents of Baltimore petitioned for a legislation to prevent African Americans from participating in trades. Unfortunately, for them, they were denied. But when the president of the Mechanical Association of Cincinnati accepted an African American apprentice, he was tried before the society.

The article also shared that landlords during the nineteenth century were not optimistic about having African Americans as tenants. They preferred to rent to whites. In 1830, an African American family tried to move to a white community in Boston. Residents were furious nd threatened to destroy the house. African Americans were simply not accepted in society. The Pennsylvania Society for the Abolition of Slavery 1838 directory gathered that of the 612 African Americans that were listed, 133 of them loved in alleys, courts, and rear building. Of the ones who weren’t forced to live in alleys, they lived in overcrowded houses.

African American may have been free according to the law, but they were still treated unjust and still remained in a captive environment. They were not allowed to progress in society. It was made sure that the superior race had no competitors when searching for a job and a home.

Questions
1. Imagine you were a free black person during the nineteenth century in the city of Louisville, how else would you attempt to make a living? Do you think rising above the occupational limitations presented were possible back then?

2. How do you feel about the term “free blacks”? Were they really free? Do you think the treatment that free blacks endured contradicts the term “free blacks”?

3. Explain why landlords during that time period refuse to accept black tenants?