Data Description: Slave Sales 1775-1865
Data set Info:
The data set includes information about each individual slave, information useful for their upcoming sale. The data has numeric information, text and geographic information. The spreadsheet consists of nine columns. The geographic information is the state and county column, the states shown are Georgia, Louisiana, Virginia, North/South Carolina, Mississippi, and Maryland. The county column lists a variety of counties within each state where a slave was sold to give a more accurate account of where in the state the slave was sold. The numeric information is split up in the date of the entry of slave information column, the age of the slave in years and month’s column and the appraised value column. For the year column the dates start at 1775 and continue to 1865 but the spreadsheet doesn’t go in order by date so the numbers jump around quite a bit. The other two columns describe the slaves age in years which tends to vary from old to young but more often doesn’t have any information at all and months column is completely empty I believe due to the fact that very few infants were sold. The last numeric information is regarding the appraised value of the slave which is varied based on the age and skill and defect of the slave. The final text information is in three columns that include the slave’s sex, skills and defects. The sex of the slave is broken into male and female. The next text column is the skills column, in which the men had skills listed as cabinet makers or gardeners and women would be cooks or midwives. The final column is the defects column. This column shows slaves that were noted with flaws. These could be as simple as too old or too young, any type of sickness they might have or if they were disruptive.
Relationships:
This information draws a lot of connections between the rows and columns. Many can be found and expanded upon. I believe the most notable relationship is the appraised value and the rest of the columns. The amount of money willing to be paid on a particular slave is changes often depending on the other columns information; gender, age, skill and defect can alter the price in any given state or county. A young male with a skill would be much higher price than an older female with a defect. Another relationship found is the one between the date in which the slave was sold and the location. Possibly revealing that in certain states and specific counties experienced a much later or earlier slave trade. Could be from slavery expanding to other states more aggressively or slowing down much later in other states. Maryland and South Carolina have some of the earliest dates on the spreadsheet, then every other state tends to pick up during the 19th century. Could be due to policy changes that America was facing that effected slave trade. The next relationship found is an obvious one between the male skills and the female skills. The males had skills that were using their hands like cabinet maker and gardener while the women had more domestic jobs like cooks or caring for children. A relationship I would be interested in discovering is one that would relate defects to either age or gender, specifically a defect that dealt with disobedience.
Process documentation:
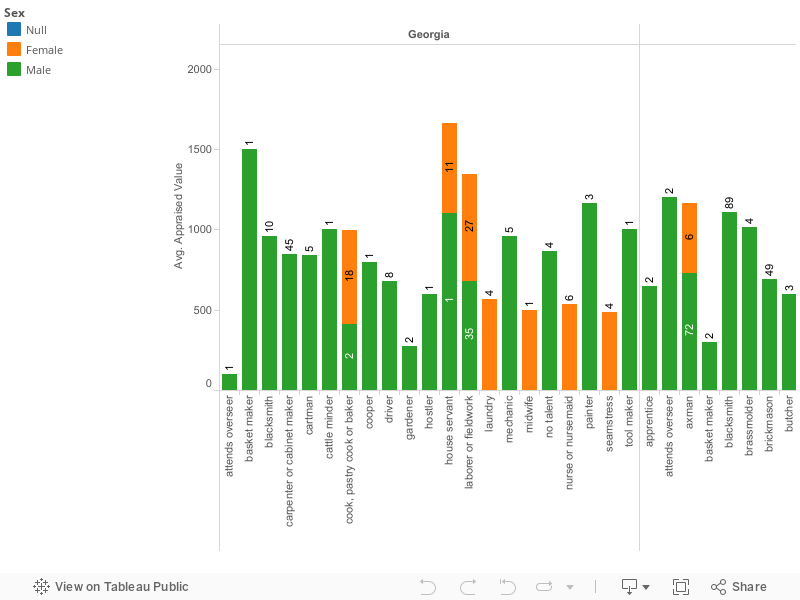
When choosing which visualization to do I wanted to have almost all of the data set represented as best as I could for my argument. The first graph I used was a bar graph. This was to show the different skills used by male and female in each state.
First the states were split up with the state name at the top of the graph, there were seven states represented in the data set. Showing each state starting with Georgia moving forward alphabetically ending with Virginia. At the bottom of the graph each skill set is included based on which state there were records in. Some states like Louisiana have numerous skills listed fifty nine in total. The state with the least amount on skills on record is Tennessee only have two skills listed and only three records, cartman with two male enslaved occupants and one male blacksmith enslaved person, the appraised value for those records wasn’t listed. Once each skill was listed the number of records each skill had is placed inside the bar graph. Knowing the number of records helps with the appraised value averages within the state. After they are given recorded numbers for each skill that number is further split by male and female. The skill is listed at the bottom the male bar is labeled with a green color, and the female bar is placed directly on top of it labeled with an orange bar. The then number of records for each skill is placed inside or just outside the bar. It was important to split male and female records for my argument that is based on how males and female enslaved peoples values are varied based upon skill, especially when males and females have the same skill set.
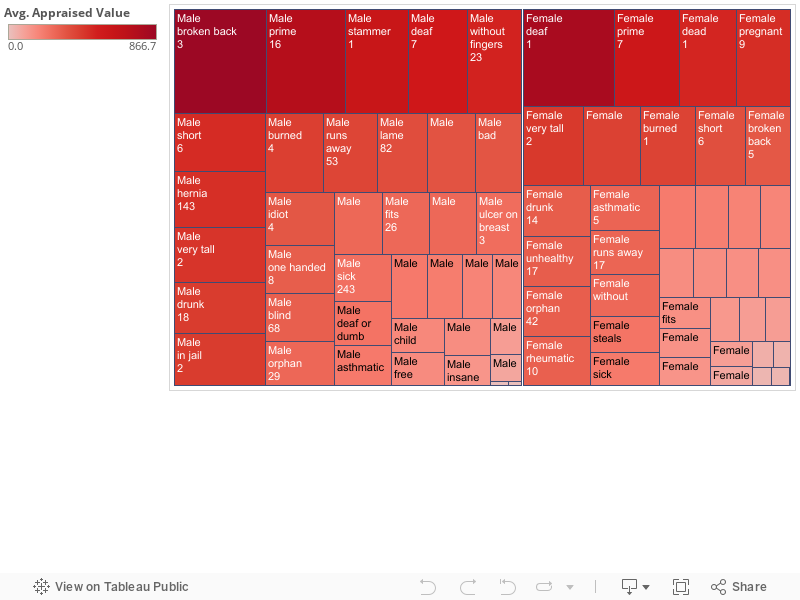
The second visual I chose was a tree graph based on appraised value for enslaved persons based on gender and defect. To start the graph I split up the enslaved persons by gender men, then added the defects they were labeled with excluding the records that had no defect mentioned. Then I added appraised value as an average instead of a count. This made the tree graph to get rid of the outliers that were taking up big spaces. The color was then chosen from dark red to light pink to show a decrease in appraised value. When choosing to how to label the graph I wanted to keep it similar to the first graph. The first label is the gender of the enslaved person, the next is the defect they were given and finally the number of records that were given for that specific enslaved persons defect. In the first box it is labeled male, broken back and the number three, all those are then used to determine the appraised value that can be shown once the cursor is over the box. The dark red indicates that is the highest average appraised value, in this case having a broken back was the labeled defect for enslaved males and being deaf for females. While the light pink shows the lowest appraised average value, enslaved males and females both show being crippled as the defect.
Both graphs show the best visualization for my argument. From the design of each to labeling and color. My argument becomes more clear with these distinct visualizations.
Story for Visualization:
Comprising the Slave Sales data set, I found the visuals that best represented my arguments by using a tree and bar graph.
The first bar graph shows the break up of each state. By splitting the data into separate states you get a better understanding of the differences that occurred in each state. Although all states mentioned partook in the buying and selling of enslaved people there were clearly differences in each. The differences were shown in the appraised value how much each state valued and enslaved male or female with a particular skill. Then the graph is split into each specific skill within the state. Some states had multiple skills, Louisiana had fifty nine skills that an enslaved person could have, among those skills were brick mason or carpenter usually occupied by men or cook and house servant usually occupied by women however, those skills did see it’s fair share of men. Then other states had very few skills. North Carolina had only six skills listen among those skills there were only sixteen records shown, that wasn’t even the lowest state with skills recorded. Tennessee only had two skills listed and three records of enslaved males with those skills. The story you get from this bar graph is how enslaved males and females were valued. During this barbaric time in American history the data set showed how men and women were bought and sold. My first graph explored the differences of the value of enslaved males and females when they were given a particular skill. By adding skills and gender I sought to give more human traits to just numbers on a paper. When listed on the excel sheet you see price but no mention of a name. Gender and age was listed but when adding a skill there is a more human trait added. This person was capable of doing something. Some of the enslaved males and one enslaved female were mechanics. That’s not a skill just anyone can pick up, it has to be taught and understood and then to be given that skill and it effect a value you must be decent at the job. For enslaved females across the listed states a common skill that affected their appraised value was that of a midwife. Again this is another skill that comes with a great deal of responsibility certainly more than working with machines these women worked to care for other pregnant women and then care for the mother and the child post pregnancy. A highly valued skill and very human trait.
The first graph I wanted to show optimism in a dark place. By showing the skills you see the human traits instead of just numbers. With the second graph the story becomes much harder to understand. In the second graph again there is split between male and female enslaved people. This time it isn’t the skills that are highlighted but the defects an enslaved person might have been given. Unlike the first graph there is no mention of states. An average appraised value is then given to the defect mentioned and the number of records are shown for each defect. The highest appraised value for an enslaved male to have is $870 with a defect of a broken back, the lowest is $5 with a defect of being crippled. For enslaved females the highest appraised value is $800 with the defect being deaf, the lowest appraised value is $.50 wit the defect also being crippled. The story of this shows more of the cruelty of slavery. Enslaved males and females were given defects and still bought and sold. Some of the defects mentioned were just the mere fact of being a child. Enslaved boys and girls were not able to escape the cruelty of being bought and sold. Other defects that were especially painful to come across were talking back, one can only imagine the suffering that was imposed upon a male or female in slavery when they disobeyed orders given. There was also a defect of pregnancy, the thought of being moved around while carrying a child isn’t easy. There were other defects that one couldn’t help, like having cancer or being blind. What these enslaved people had to endure must have been harsh and I cannot imagine having a sickness on top of living the life of an enslaved person. I highly doubt they were treated kindly. The second graph shows more of the cruelty given during these times. How these people that were just look at like property suffered more than we can imagine.
When deciding the two graphs it wasn’t enough to just highlight what the data set showed. The story that I was hoping to express was the people behind the numbers. When the data was converted to an excel sheet the story of the individual was still not mentioned. Forming the data to show more human traits shows more than the numbers could. Seeing a person being appraised for $500 is one thing but to know that the enslaved person listed was deaf adds a deeper component. The same goes for skills shown. Seeing an enslaved woman being appraised at $460 might not make anyone think twice about who she was, but giving her a character trait that she was a tailor puts more humanity to her. These aren’t just numbers they are people that suffered with things we still suffer from today and had skills that we still value.
Argument:
Slavery plagued America like so many other countries in the past. Today slavery still isn’t completely eradicated from the world however, we are still examining the troubles that occurred on our own soil. With the help of the data set of slave sales used you can get a clearer idea of what happened during the times of 1742 to 1865. Arguments can be made based on the way one chooses to construct the given numbers, dates and text shown. Although it hardly paints a full picture some conclusions can be discovered. The way I choose to arrange the data set was split between male and female and their value based on skills and defects.
The data shown in the two tree graphs labels each enslaved person with a particular skill on one and a defect in the other. From there the data is then broken down into male and female showing each skill men have and on the other side women this is also shown in the defects chart as well. Next the tree graphs shows the appraised value a male or female enslaved person would receive upon having a particular skill or defect. Although values for enslaved people rises during the years there is a connection between having a particular skill or defect that can also affect the value. Skills are shown to commonly be separated by gender; this might make sense in a southern society that believes in gender roles even when it comes to enslaved people.
Males tend to have more of the common masculine skills, from mechanic, blacksmith, shipbuilder and cartman or someone who drives a horse carriage. Based on these skills their values varied accordingly, the average appraised value for a mechanic was around $1,200 which is the highest appraised value for a male enslaved person with a skill. The lowest appraised value for a male enslaved person with a skill was $250 as a rope maker. Both the highest and lowest appraised valued skill tends to be a more male oriented occupation.
The females had skills that varied in more of the famine roles and occupations. There were skills in hairdressing and seamstress. As well as cooking, baking and other household skills including raising children and laundry. The highest appraised value for a female with a skill was $1,000 as a hairdresser, the lowest appraised value was a spinner at $200.
Already there is a pattern where the men enslaved persons are getting a higher appraised value then the women enslaved persons the argument can be made that the skills were different from male to female but that isn’t always the case. There are particular jobs that both men and female enslaved people share that aren’t distinct between male and female gender roles as well as certain skills that are shared among the two genders that do cross gender roles. Jobs that have no gender role for an enslaved person in the south would be that of a labor or field worker. When thinking of slavery in the south the image that appears in the mind is that of both men and women doing hard labor on a plantation. Labor work has no gender role and the male enslaved are valued at $630, while women enslaved have an average appraised value of $550. There were also skills that crossed across gender roles. Enslaved females also worked as mechanics. There was one recorded record of an enslaved female during the data set timed period in the small number of states listed that had the mechanic skill. Her appraised value was $600 in the state of Louisiana where there were thirty five male mechanics all valued at twice her rate.
Looking at skills there is a pattern of women enslaved people being appraised higher than male enslaved people. Of course there are some outliers like in the case of South Carolina, a more male gender role skill of a driver, the enslaved male tends to be appraised higher. This is due to the fact in the other states mentioned there isn’t a female enslaved skilled driver. However, in South Carolina there is one recorded of an enslaved female skilled driver and she was appraised at a much higher value of $1000 than the enslaved males appraised at $600. The same goes for enslaved males in female gender roled skills. In most other states labeled the female enslaved person with skill of baker or cook they are appraised at a higher rate than the enslaved males with the same skill. Again in South Carolina you see a different pattern where the enslaved males with the baker or cook skill are appraised higher than the females. In this case the male enslaved person has the average appraised value of $300 while the enslaved female is appraised at $125.
Although there are peculiar cases when the gender role skill has the opposite effect on the average appraised value enslaved males still tend to be appraised higher. When you take out skills completely and focus on the tree graph you see the effect that defects had on the appraised value of enslaved people.
The second tree graph shows the effect of average appraised value when it comes to defects that enslaved males and females were given during the time period. For almost all defects labeled, it is shared between male and female, the only difference being enslaved females being pregnant with nine records shown and the average appraised value of $475. This would be impossible to compare to an enslaved male defect. But for the rest of the defects there is a record for both male and female enslaved persons. The highest average appraised value for an enslaved male with a defect is a broken back, with three records shown the appraised value is $870, while the enslaved female with the same defect is appraised at $320 with five records shown. That pattern of enslaved males being appraised higher with defects continues for almost all defect labeled. The only difference being enslaved females with the defect of being deaf are appraised much higher than the enslaved males with the females being appraised at $800 and the males appraised at $550.
Today there is still a gap in equality among men and women and appraised value. The case shown in the graphs below are just a more barbaric viewing of still present inequality. But the argument remains the same and the data set further proved a point of how men and women are still not equal and how much work we still need to do.
Research Questions:
When diving into this particular data set it was hard to comprehend exactly what I was looking at. Shown nameless it was often forgotten that the numbers on the excel sheet were actually people that were bought and sold in the same country I call home, and a practice that just ended a few hundred years ago. The data set had to be take apart and manipulated to give these numbers traits that went beyond an appraised value. However further questions still remain when trying to get more human traits out of these numbers.
When the information was put into excel I have doubt that the original data set had names. That would have been a useful tool. Giving more humanity to the numbers and values and skills would have brought more meaning to the data set. It would have been interesting to know where these enslaved individuals moved to and where their linage ended up. By gaining names along with the skills it would have been interesting to see how far a particular skill lasted in the linage or if the skill was a helpful tool when slavery had ended. Same can be said for given names to follow along with the defects. If the pregnant women had successful child births and did the children have to suffer like the parents did.
When looking at skills I wondered how the skills were obtained. If it was taught from enslaved person to person or from another source. And then how useful that skill was in helping that enslaved person from day to day. If it meant they were given a less harsh treatment or if they were given a harsher treatment because having a skill meant they could do more work. I’d also be interesting in knowing how the enslaved people with defects managed their day to day life. Some had cases of missing fingers, that’s not easy to deal with but it is not as bad as being enslaved with cancer or being blind. I wonder If they were able to see doctors or if they died was family given bereavement time, did they have family at all.
Finally my question would be of skills and defects in northern states. The data set shown is only the southern states which already has the awful slavery reputation but the north still partook in the terrible act. I’d wonder if the skills were the same or if there were skills not needed for the south. I’d like to know how skills and defects affected appraised value in the north and if the enslaved people with a sickness were even considered a defect or was life for an enslaved person in the north more humane.
Adding more information to the data set would have helped my argument especially when comparing and contrasting the differences between the males and females. It would also help when giving more human traits to the enslaves people.